Encounter 18 (2023-12-24 - 2024-01-09)
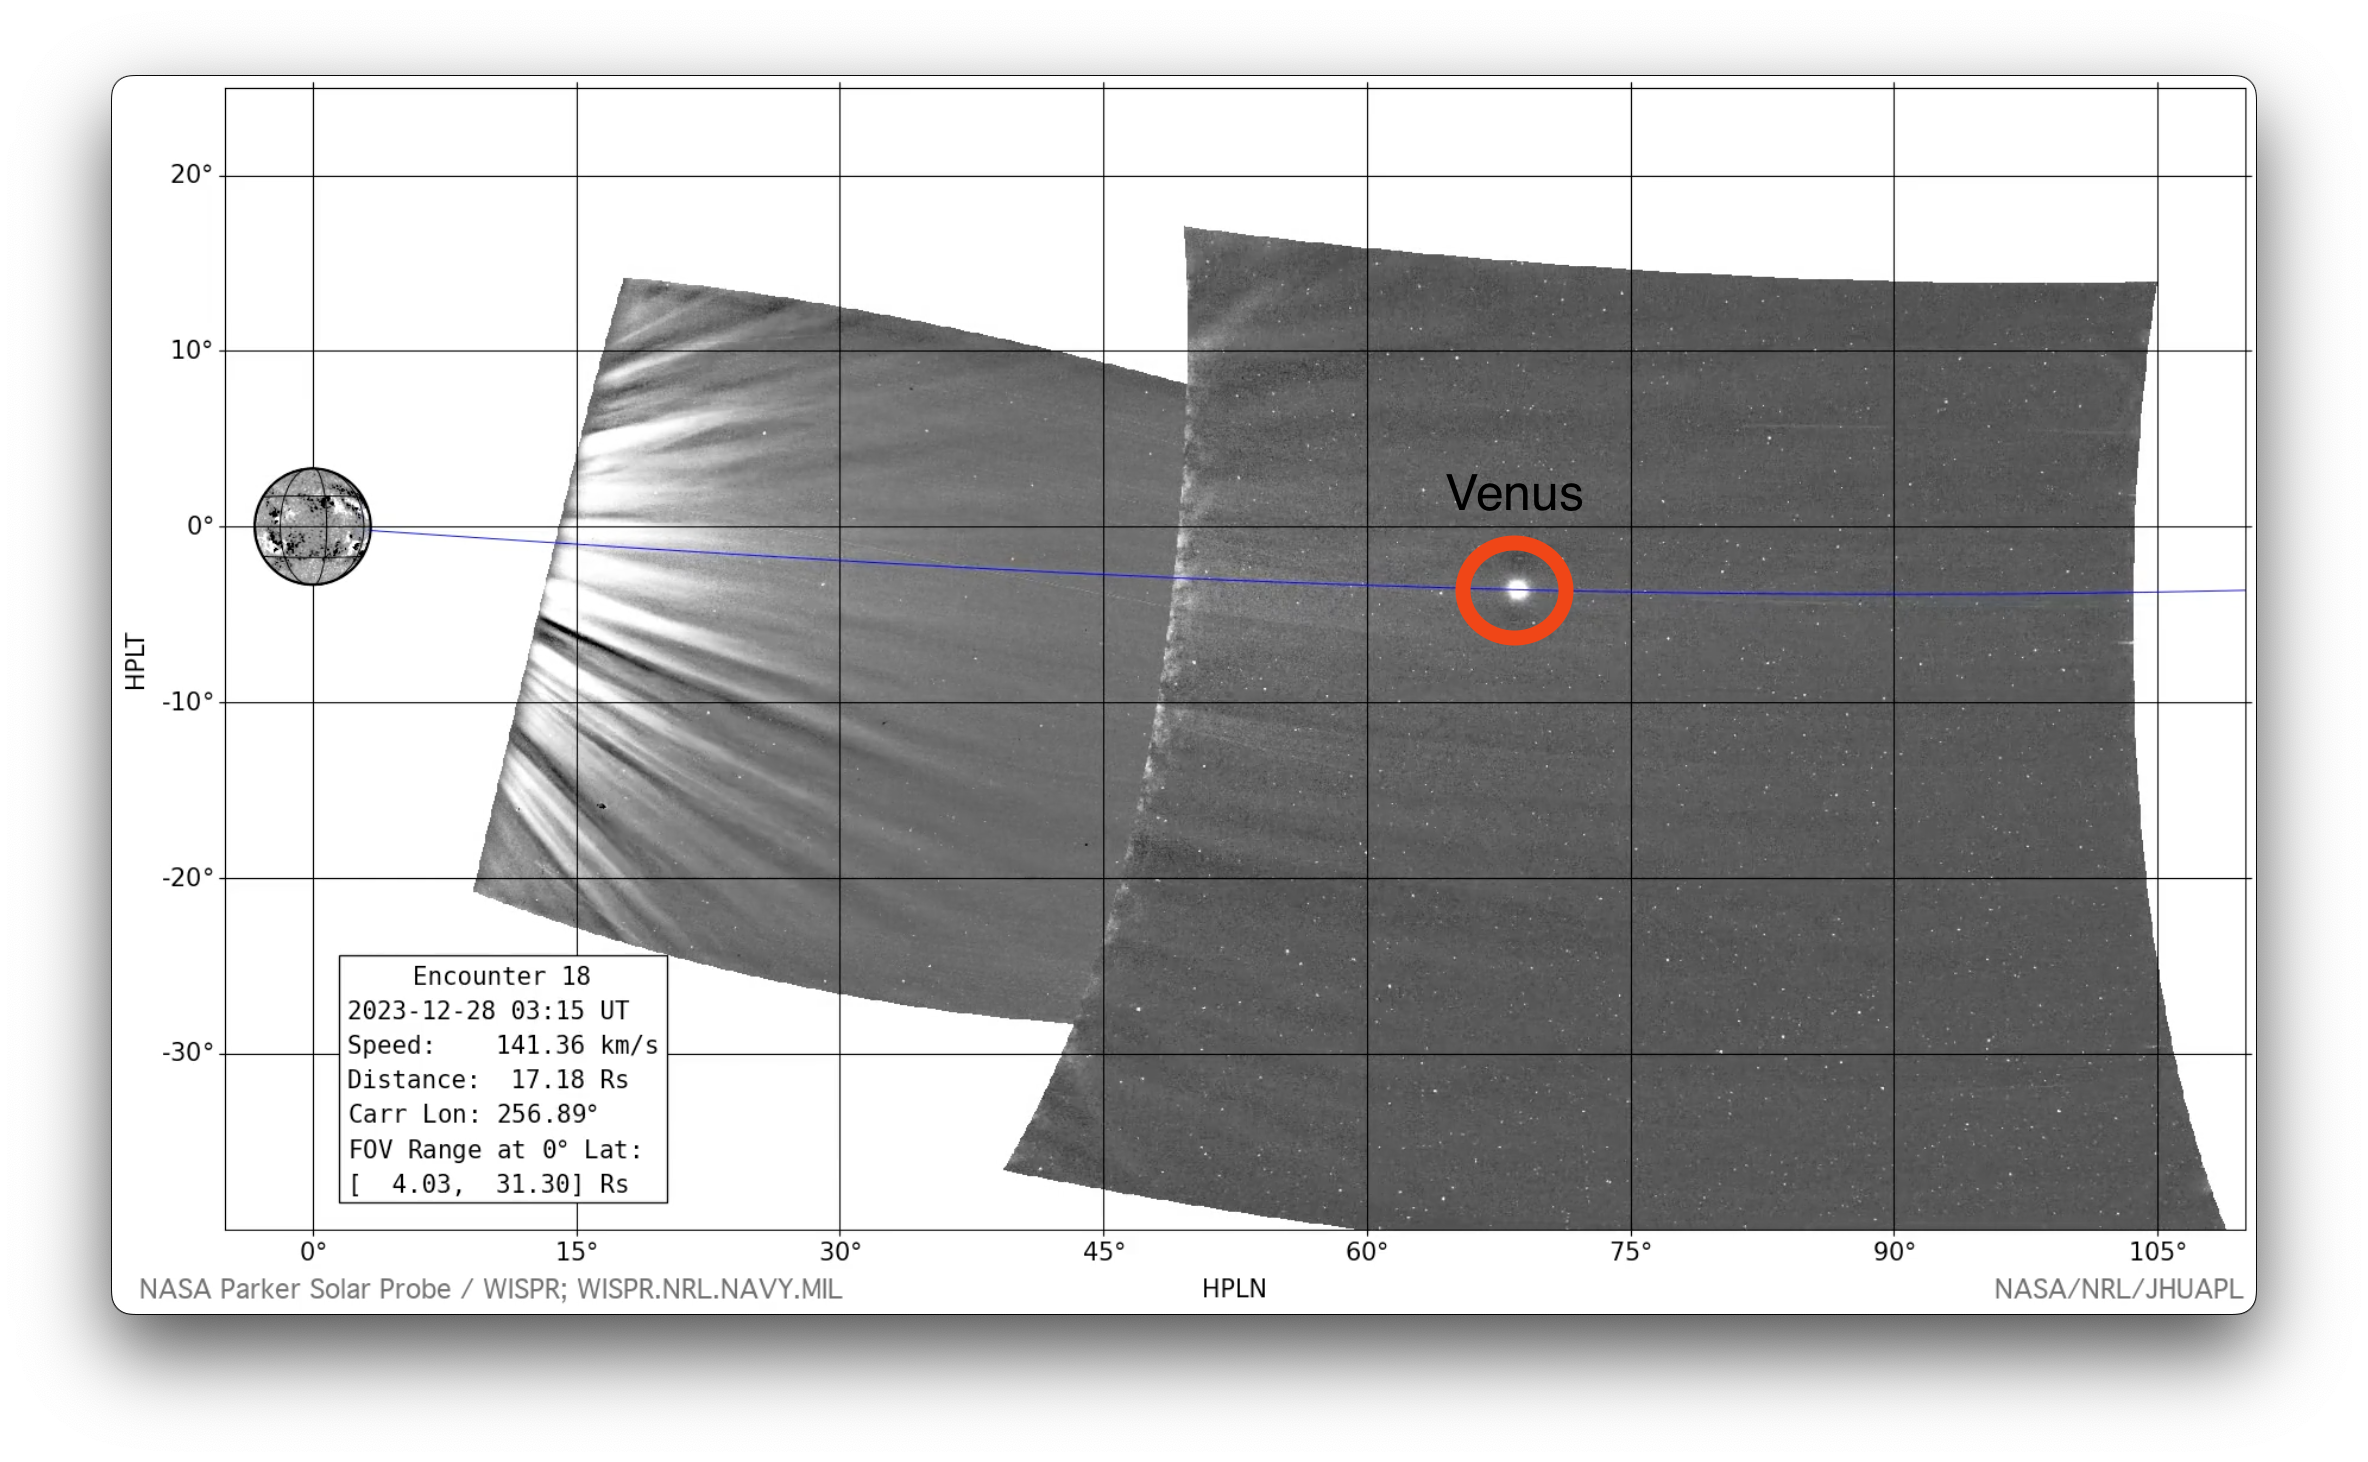
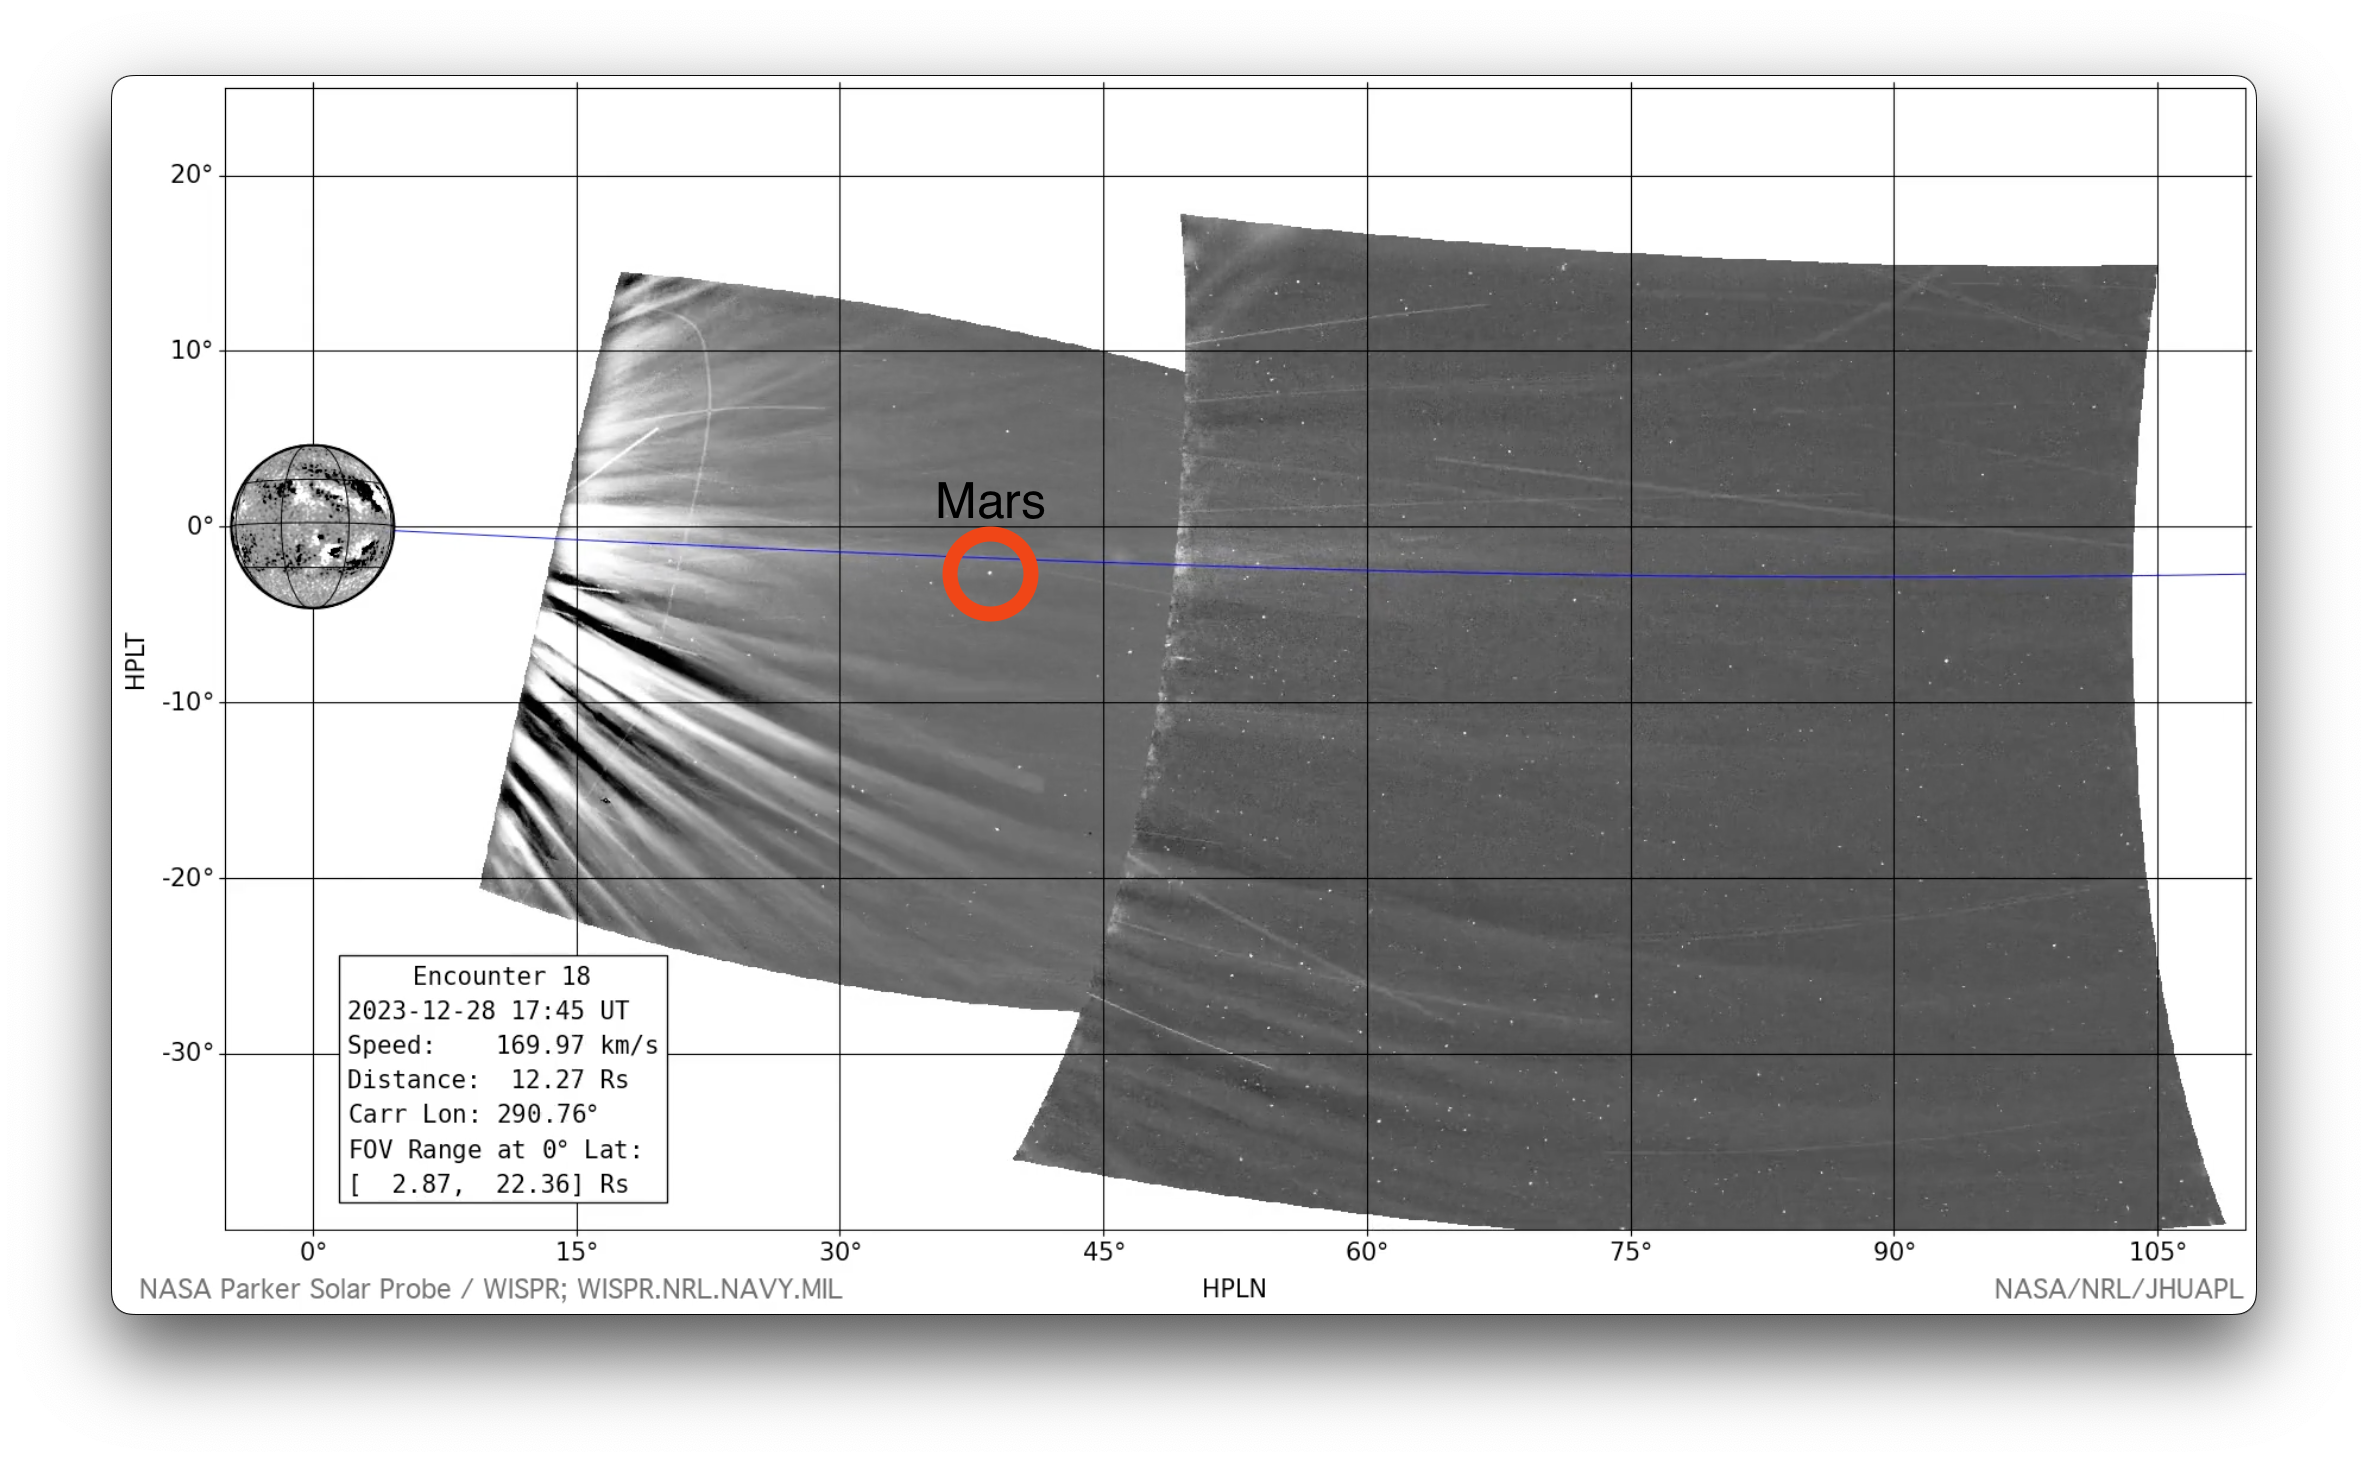
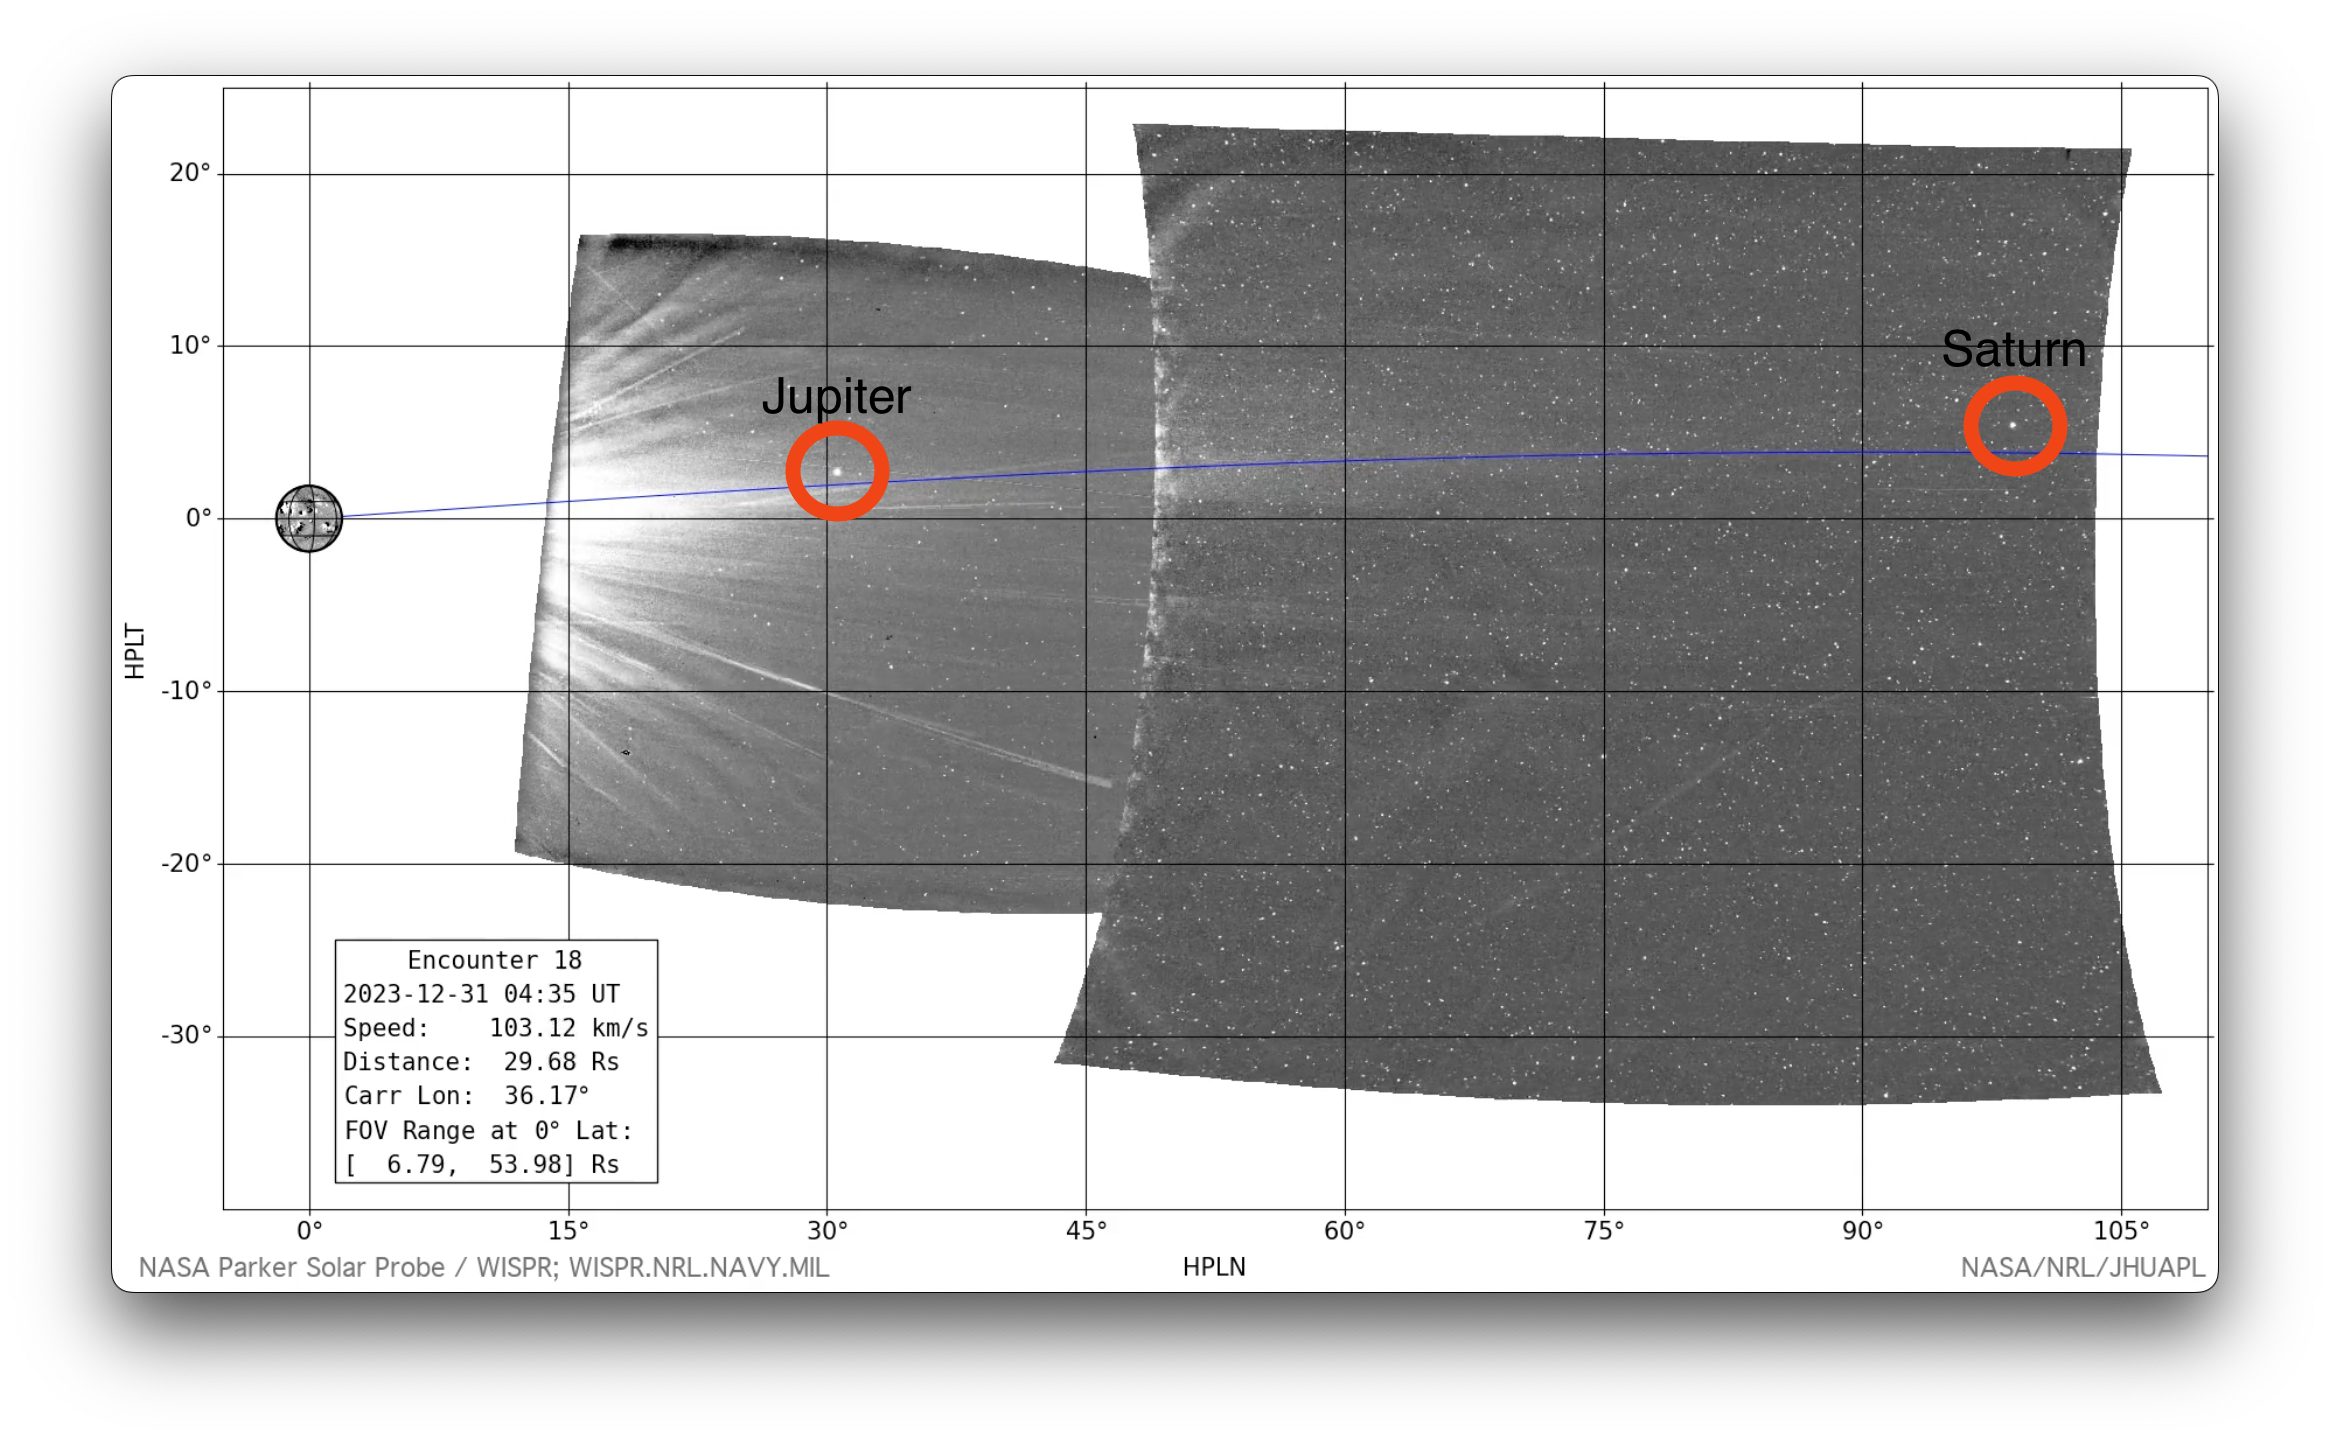
This animation shows all L3 WISPR full-field observations from the eighteenth PSP Mission Encounter (2023-12-24 - 2024-01-09). We have superimposed a grid showing helioprojective longitude and latitude, and a scale representation of the size and location of the Sun in the observations using the SDO/HMI Carrington map for this time period. The velocity and distance metrics displayed on the movies correspond respectively to the spacecraft's heliocentric velocity in kilometers per second, and its distance from the Sun's center in units of solar radii (where 1 solar radius = 695,700km). The "FOV Range" label provides the plane-of-sky distance limits of the inner and outermost edges of the fields of view, in units of solar radii. The horizontal blue line indicates the orbital plane of PSP. The timespan of this composite movie covers only the nominal science window when the spacecraft was within 0.25 au; a limited amount of data outside of this range may be available at the below links.
You can download this movie directly as an 99MB mp4 file. This sequence is also available as a 653 MB mp4 file processed via the LW Algorithm developed by Dr. Guillermo Stenborg (JHUAPL) and detailed in Appendix A of Howard et al. 2022 (ApJ, 936, id.43. DOI 10.3847/1538-4357/ac7ff5). Team contact information can be found in Section 1.2 of the WISPR User's Guide [PDF link].
[Credit: NASA/NRL/JHUAPL. Movie processed/compiled by Guillermo Stenborg (JHUAPL) and Karl Battams (NRL). SDO inset courtesy of NASA/SDO and the AIA, EVE, and HMI science teams.]
Solar Features
2023/12/24 21:00 CME
2023/12/25 11:15 CME
2023/12/26 08:30 Streamer Blob
2023/12/28 05:00 Streamer Blob
2023/12/28 17:45 Quasi-static Loops
2023/12/28 22:45 CME
2023/12/29 03:00 CME
2023/12/29 11:45 CME
2023/12/30 10:30 CME
2023/12/31 06:30 Streamer Blob
2023/12/31 22:15 CME
Comets and planets
Comets TBD
- Earth, beginning start of Encounter (WISPR-O)
- Mercury, beginning start of Encounter (WISPR-O)
- Venus, beginning start of Encounter (WISPR-I)
- Mars, beginning approx. 2023-12-28 11UT
- Saturn, beginning approx. 2023-12-29 07UT
- Jupiter, beginning approx. 2023-12-30 13UT
Operations summary
There were no spacecraft or instrument operations that affected the data during this encounter.
Miscellaneous notes
None.
Encounter 18 Data Products
- Encounter 18 Level-2 FITS (18 GB zip file)
- Encounter 18 Level-2b FITS, Background Models (12 GB zip file)
- Encounter 18 Level-3 FITS (14 GB zip file)
- Encounter 18 L1 and L2 Summary Files (<1 MB zip file)
- Encounter 18 Level-3 PNGs, Inner camera (1.9 GB zip file)
- Encounter 18 Level-3 PNGs, Outer camera (1.9 GB zip file)
- Encounter 18, Inner mpg, 480x512px (35 MB)
- Encounter 18, Inner mpg, 960x1024px (238 MB)
- Encounter 18, Outer mpg, 480x512px (156 MB)
- Encounter 18, Outer mpg, 960x1024px (857 MB)
- Encounter 18, Inner mvi, 480x512px (549 MB)
- Encounter 18, Inner mvi, 960x1024px (2.2 GB)
- Encounter 18, Outer mvi, 480x512px (461 MB)
- Encounter 18, Outer mvi, 960x1024px (1.8 GB)
Encounter 18 J-maps, R-maps, and Lat-maps
The following data products are J-maps, R-maps, and Lat-maps for this Encounter, provided by NASA/JPL/CALTECH. Some reference on the use and interpretation of elongation versus time maps (aka J-maps) are Sheeley et al., 1999 ( DOI: 10.1029/1999JA900308), Sheeley et al., 2008 ( DOI: 10.1086/529020) and Rouillard et al., 2010 ( DOI: 10.1029/2009JA014472). A reference for the creation and use of R-maps is Nindos et al., 2021 (DOI: 10.1051/0004-6361/202039414). Various ways of constructing Latitude versus Time maps are described in Poirier et al., 2020 (DOI: 10.3847/1538-4365/ab6324), Nindos et al., 2021 (DOI: 10.1051/0004-6361/202039414), and Liewer et al., 2023 (DOI: /10.3847/1538-4357/acc8c7).
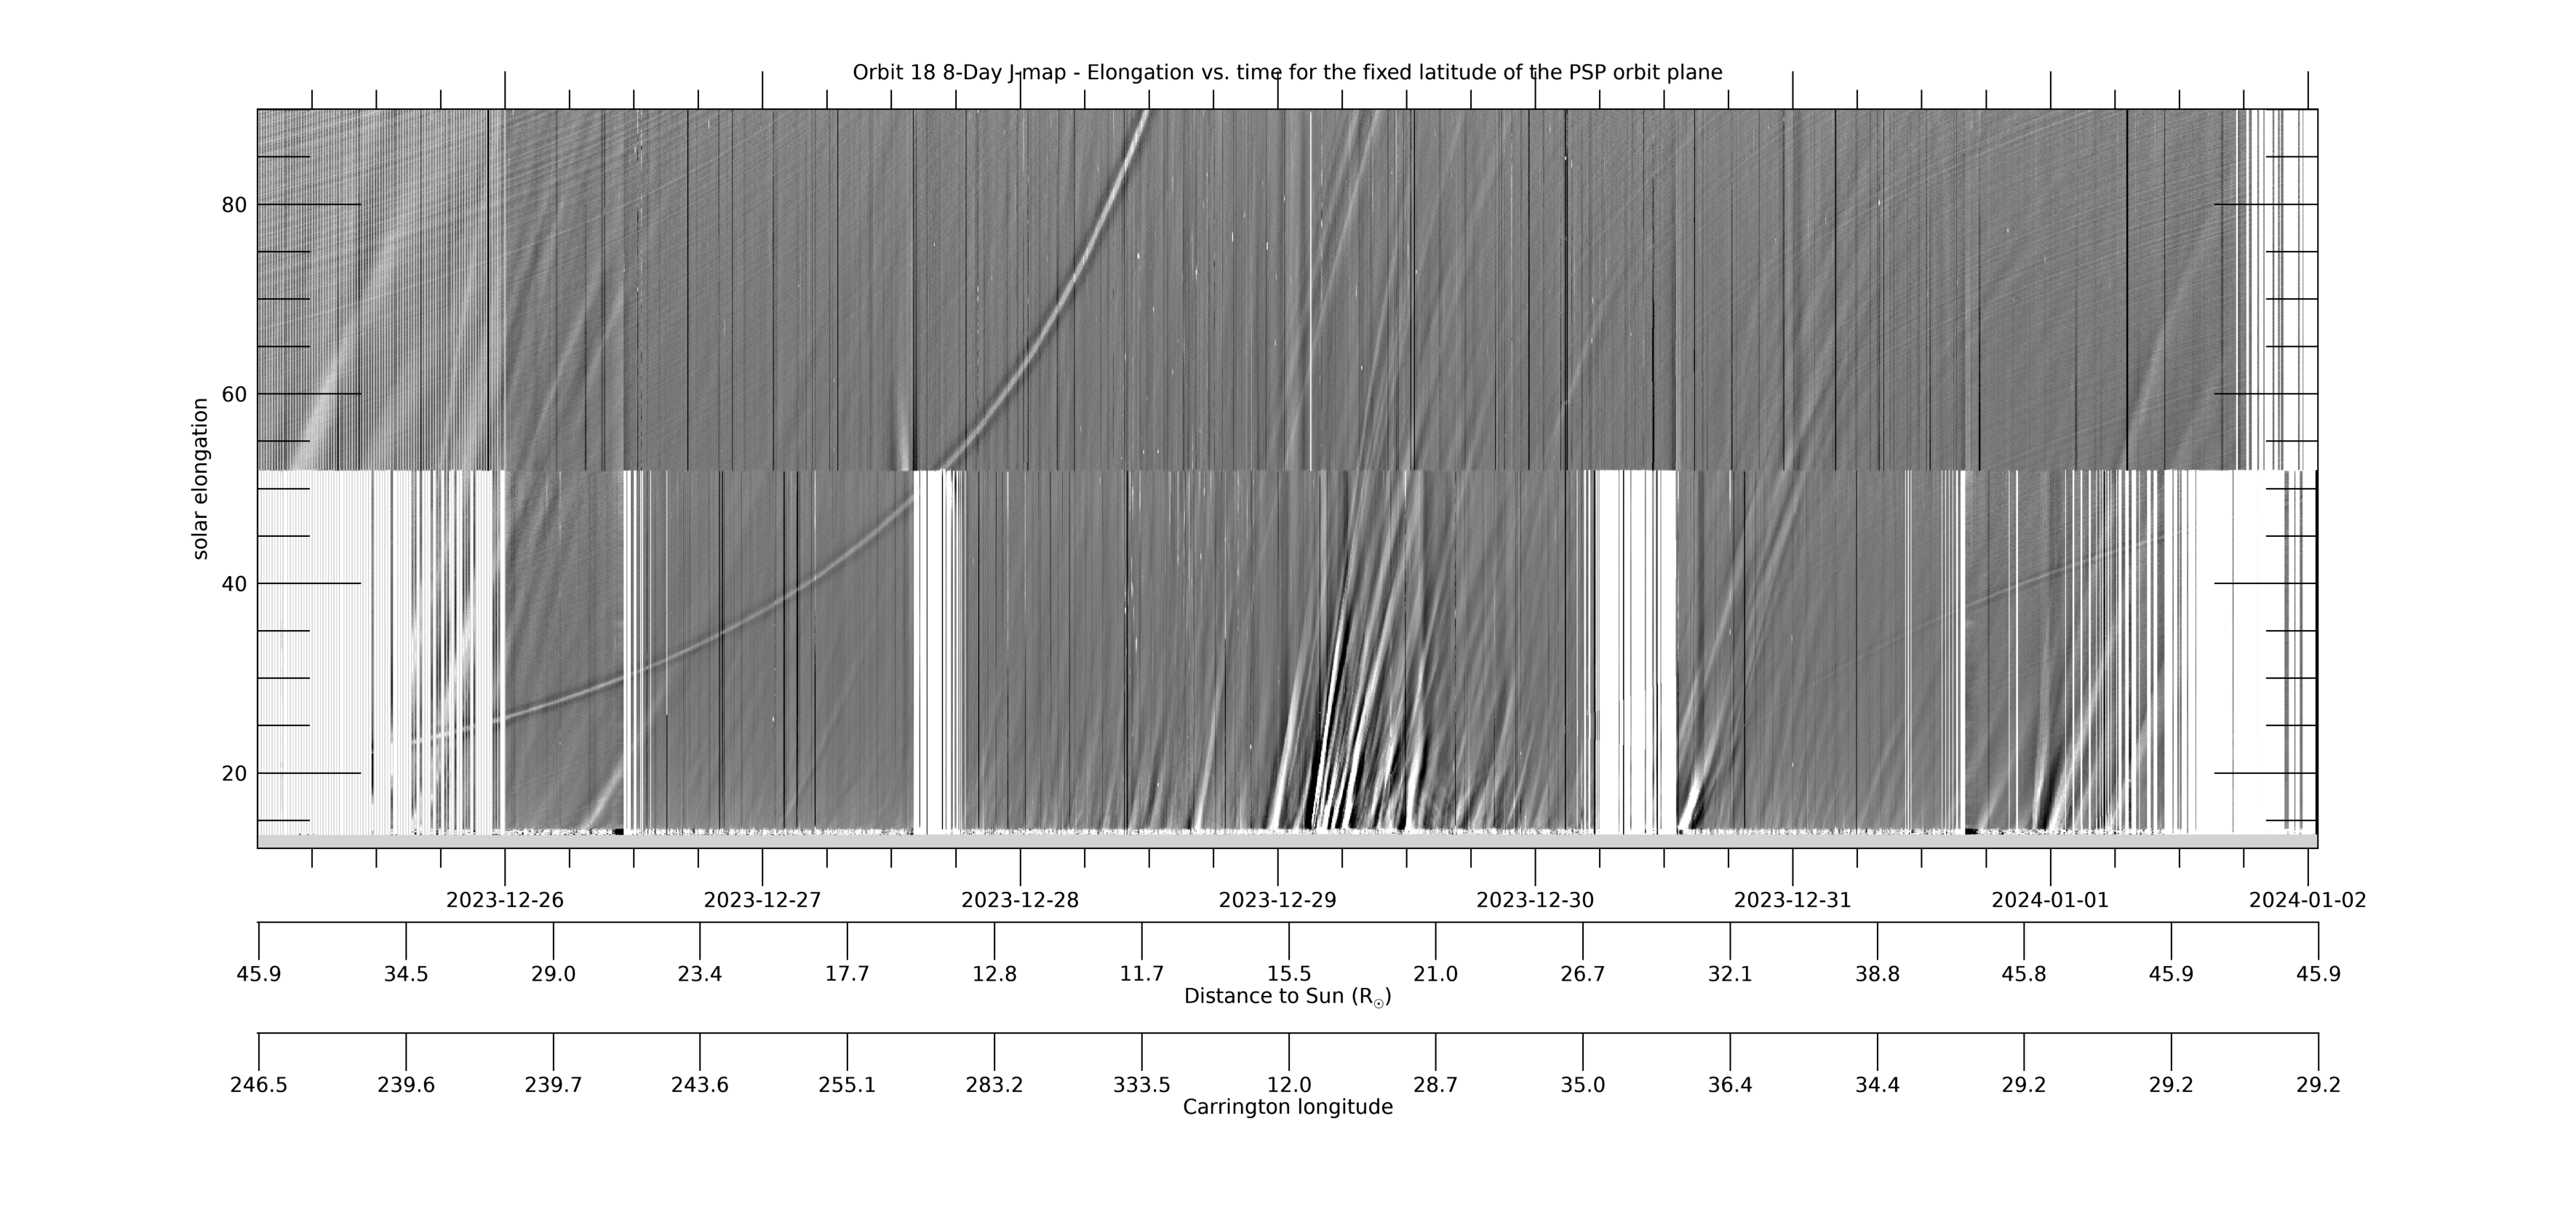
[ABOVE] This 8-day WISPR J-map shows solar elongation (angle from the Sun center) versus time at a fixed latitude measured relative to the PSP-Venus orbit plane. It is created from composite LW-processed full field-of-view (FOV) composite images such as those in the LW movie above, in which the PSP-Venus orbit plane is marked with a blue line. For each image (each time), data is collected along the PSP-Venus orbit plane for the full range of elongations in the WISPR FOV. The collected data is then stacked in time (x-axis) with elongation as the y-axis. The WISPR movies at this web site can be used to identify and find the cause of the various features seen in the J-map. Below the time axis are two additional axes showing PSP’s distance to the Sun RP and its Carrington longitude at that time. The time span in this and subsequent maps is centered on the time of perihelion. [Credit: NASA/JPL. Data processed by Paulo Penteado (JPL/Caltech).]
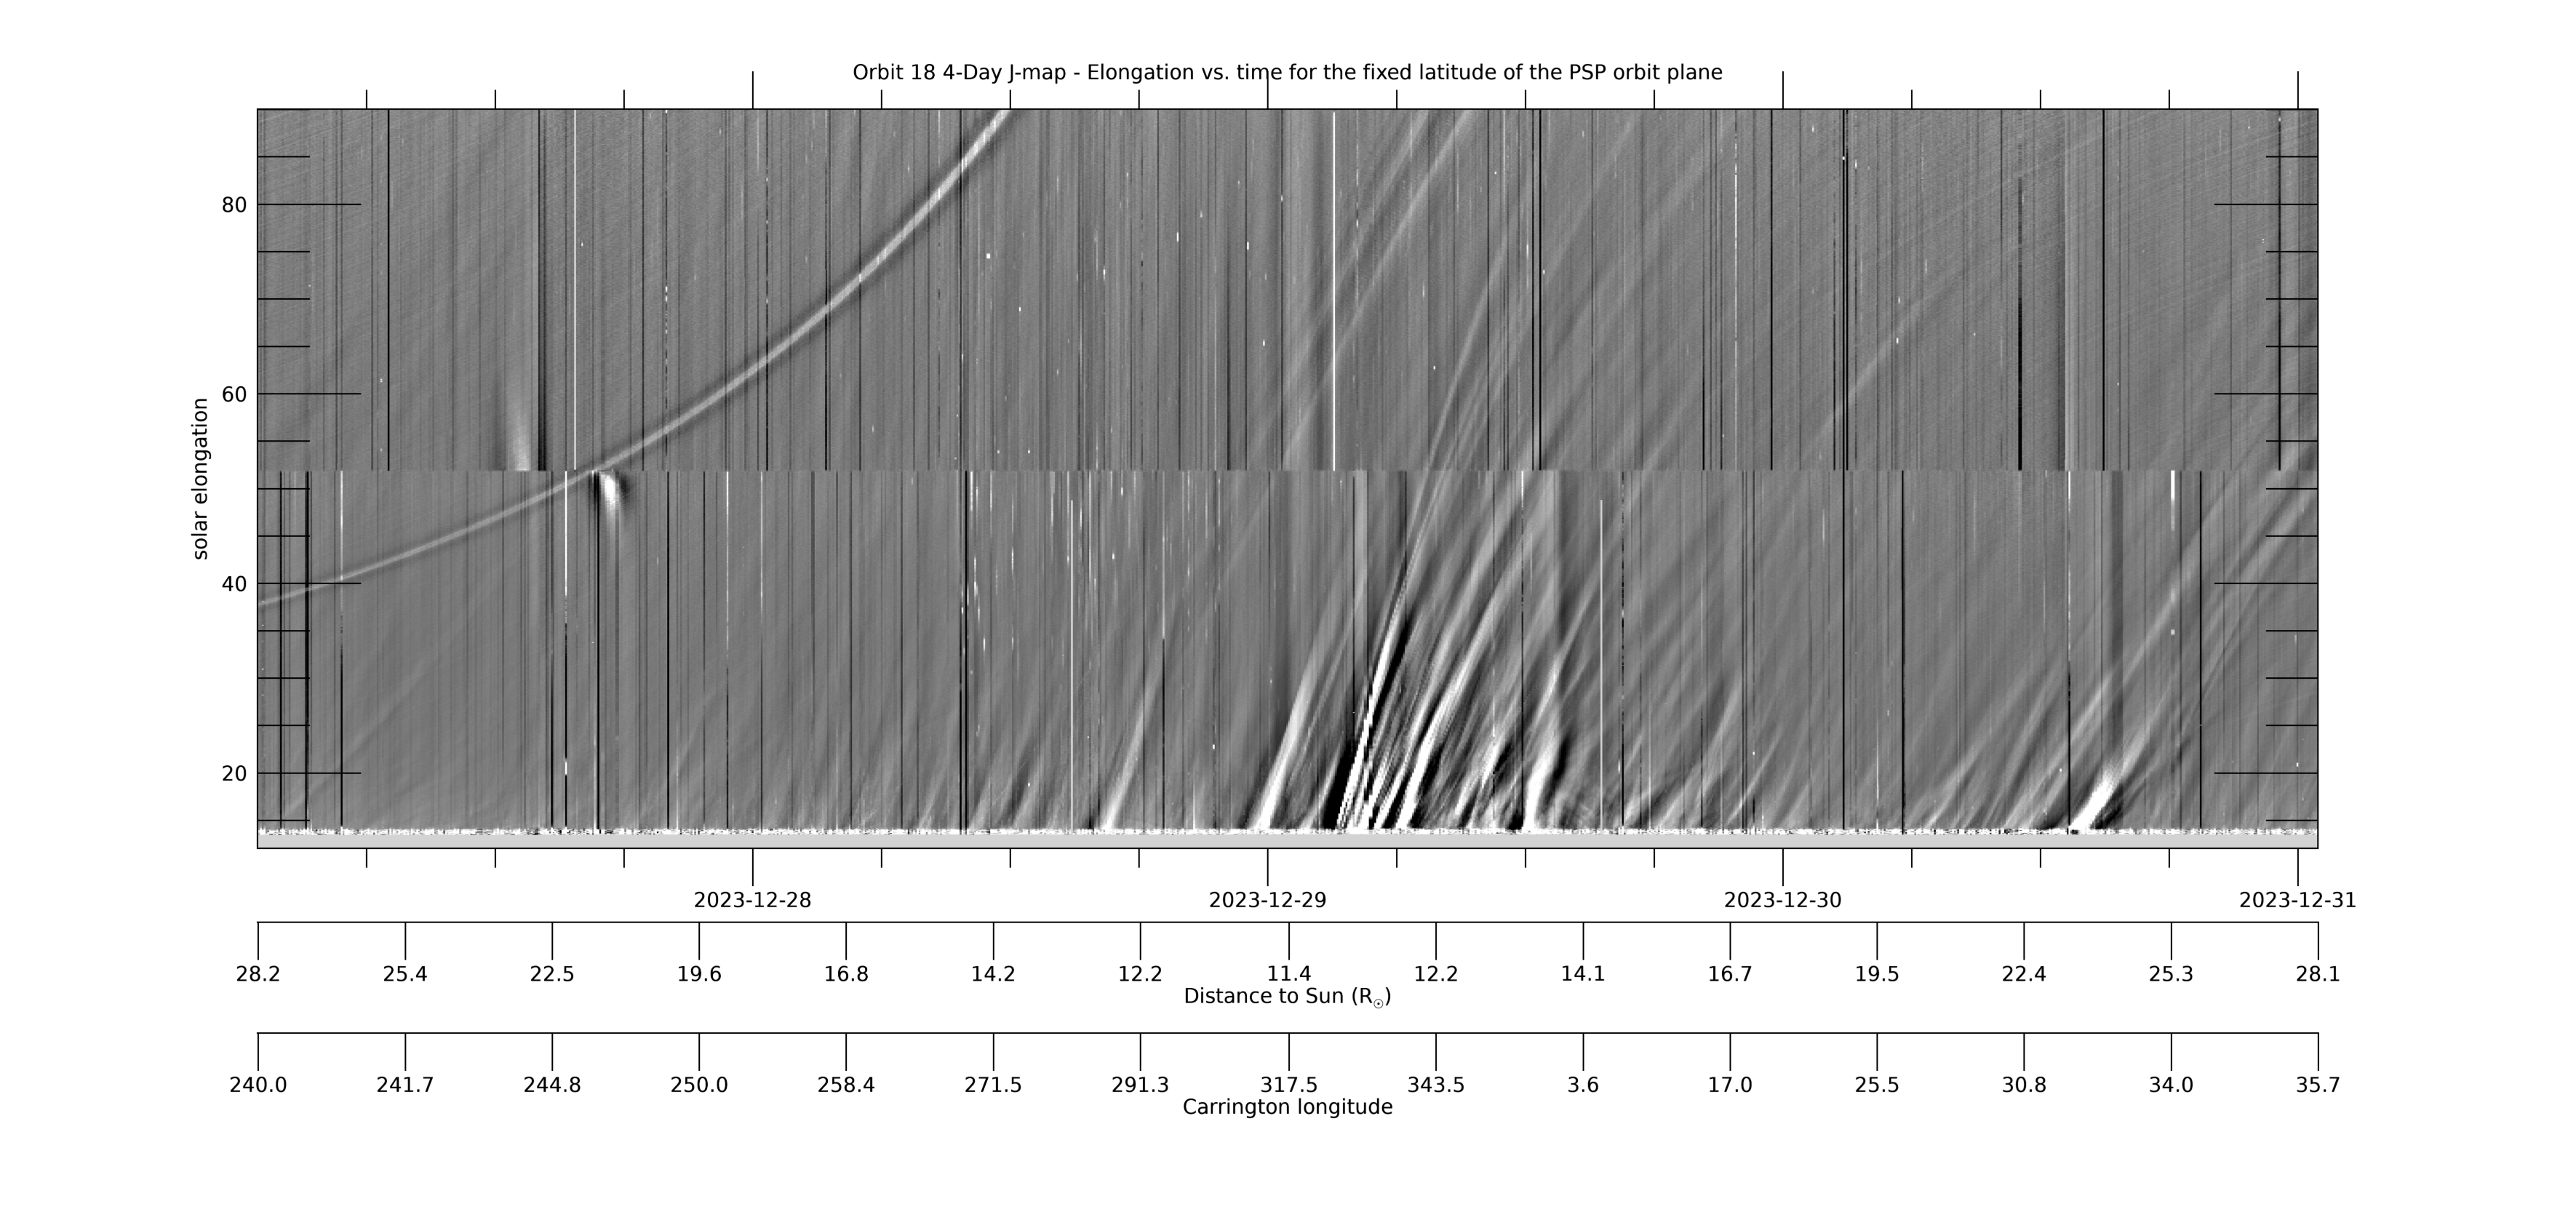
[ABOVE] This 4-day WISPR J-map uses the same data as the 8-day J-map above, but shows only 4 days, centered on perihelion, and only includes distances to 25 R☉ to provide better resolution. See the caption above for more information. [Credit: NASA/JPL. Data processed by Paulo Penteado (JPL/Caltech).]
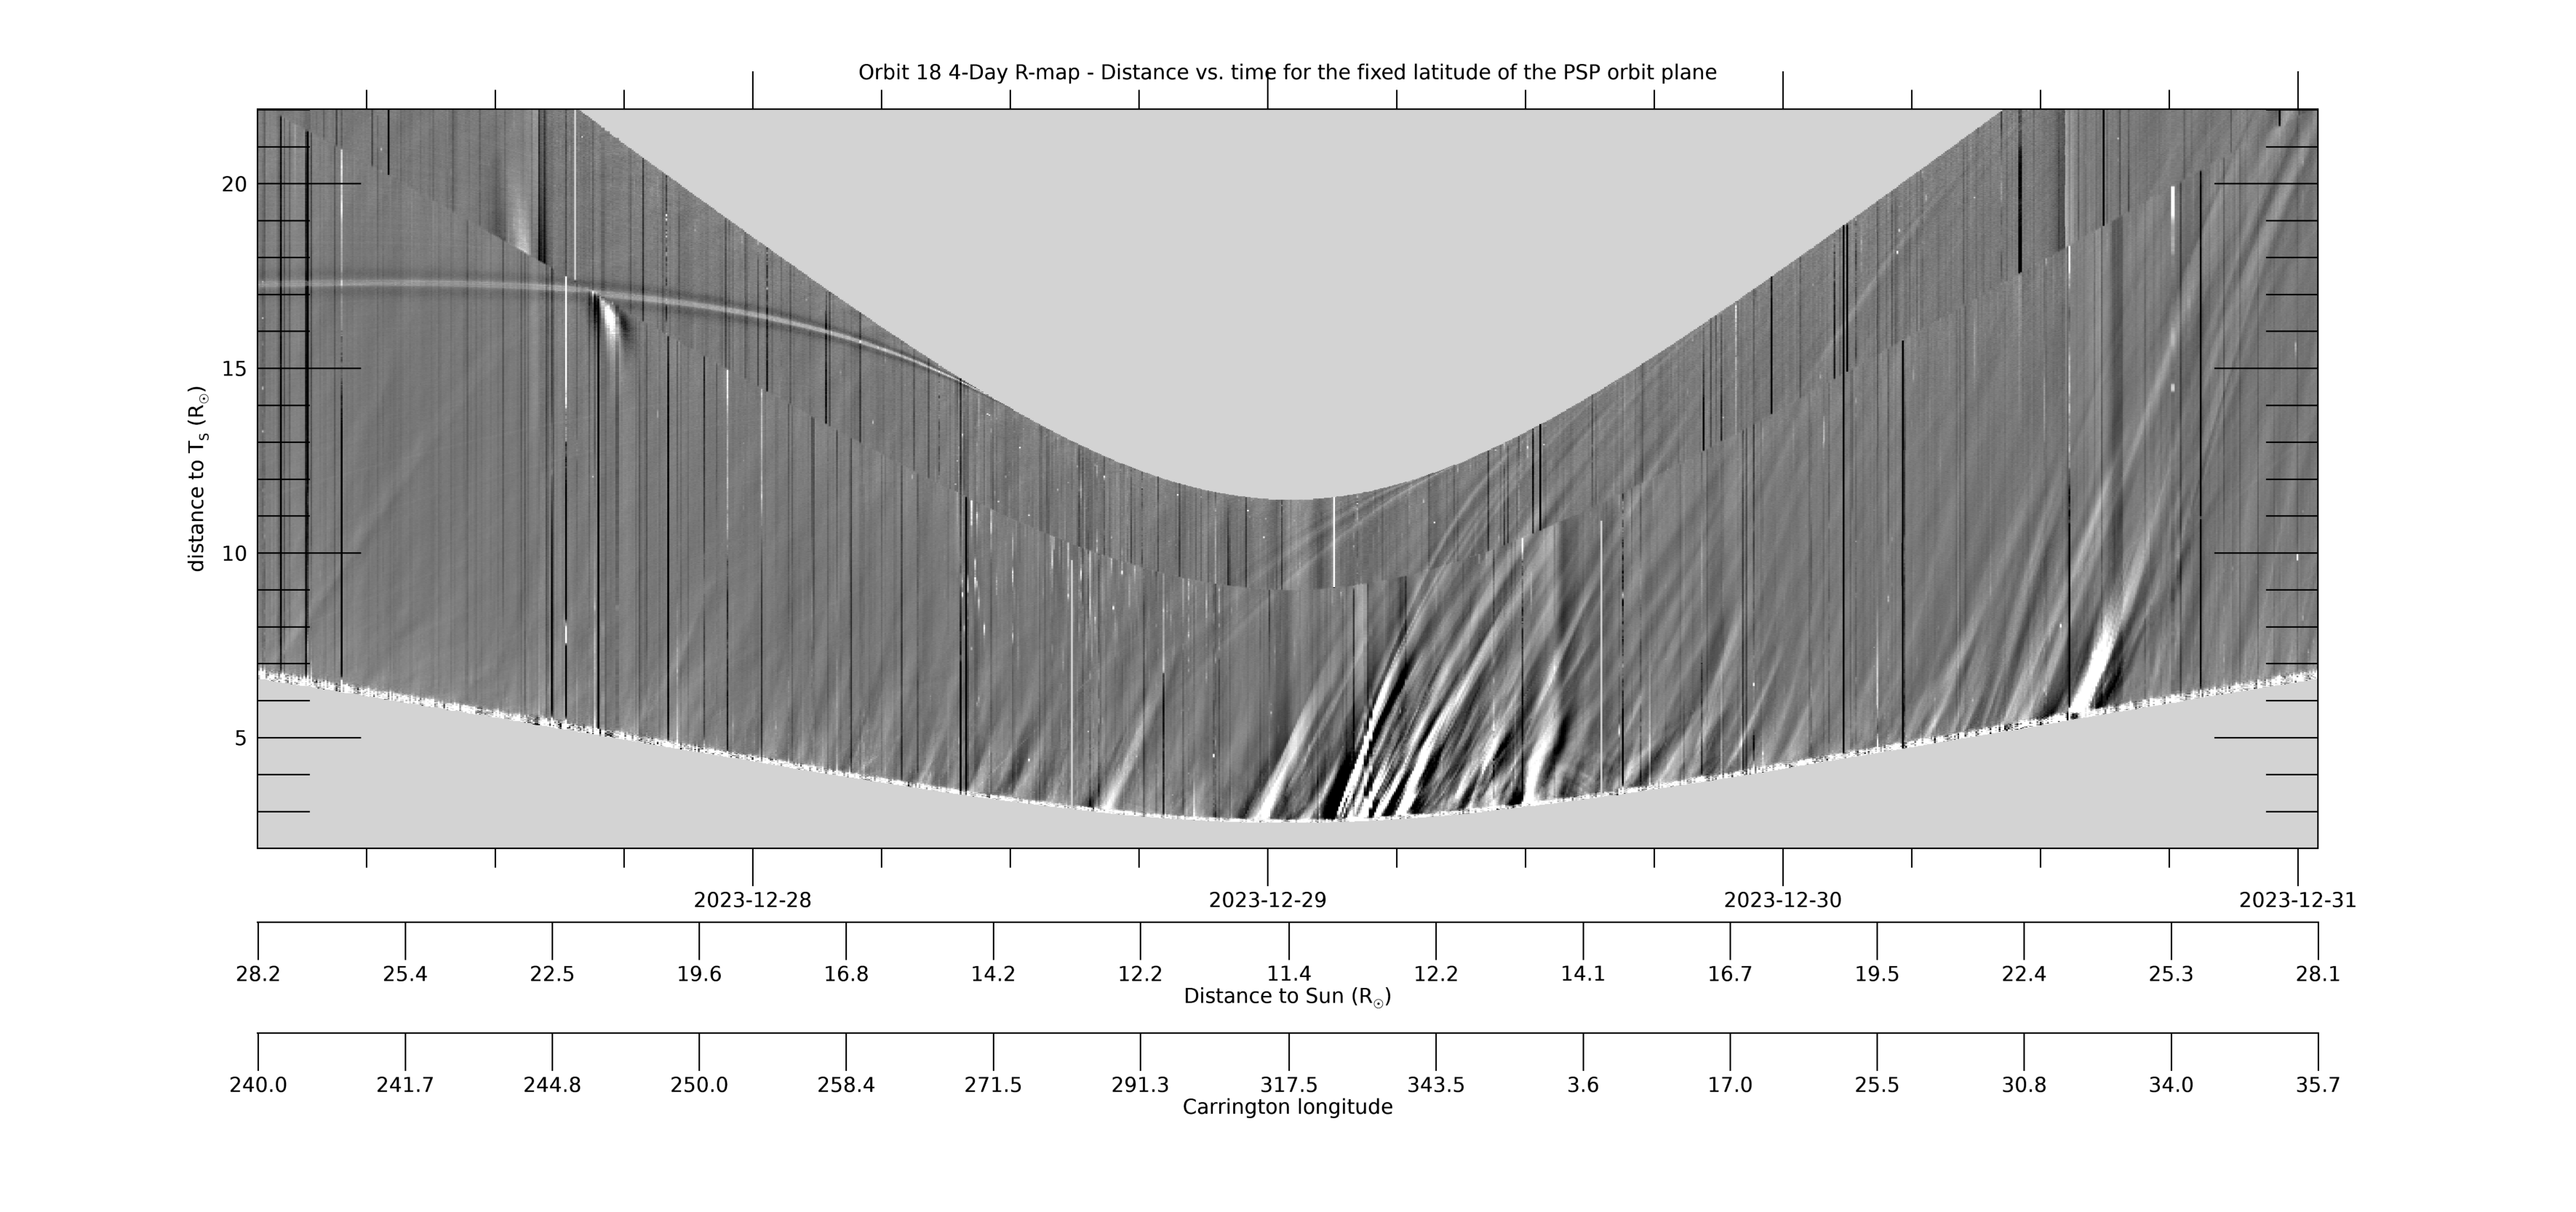
[ABOVE] This 4-day R-map uses the same data as the 4-day J-map (the data collected at each time/image along the PSP-Venus orbit plane), but makes the assumption that the (line-of-sight integrated) signal at each solar elongation all comes from where that line-of-sight hits the Thomson sphere, which is the location of maximum sensitivity of a white light telescope (see, e.g., Vourlidas & Howard, 2006, ApJ,642,1216; DOI: 10.1086/501122). This distance RT (the new y-axis) is related to the elongation by RT=RP*sin(elongation), where RP is PSP’s distance to the Sun. The R-map can be considered a “height-time” plot with and such maps can be used to estimate of the velocity of the observed transients. The LW composite movie above can be used to identify and find the cause of the various features seen in the R-map. Only data up to 90° has been included. [Credit: NASA/JPL. Data processed by Paulo Penteado (JPL/Caltech).]
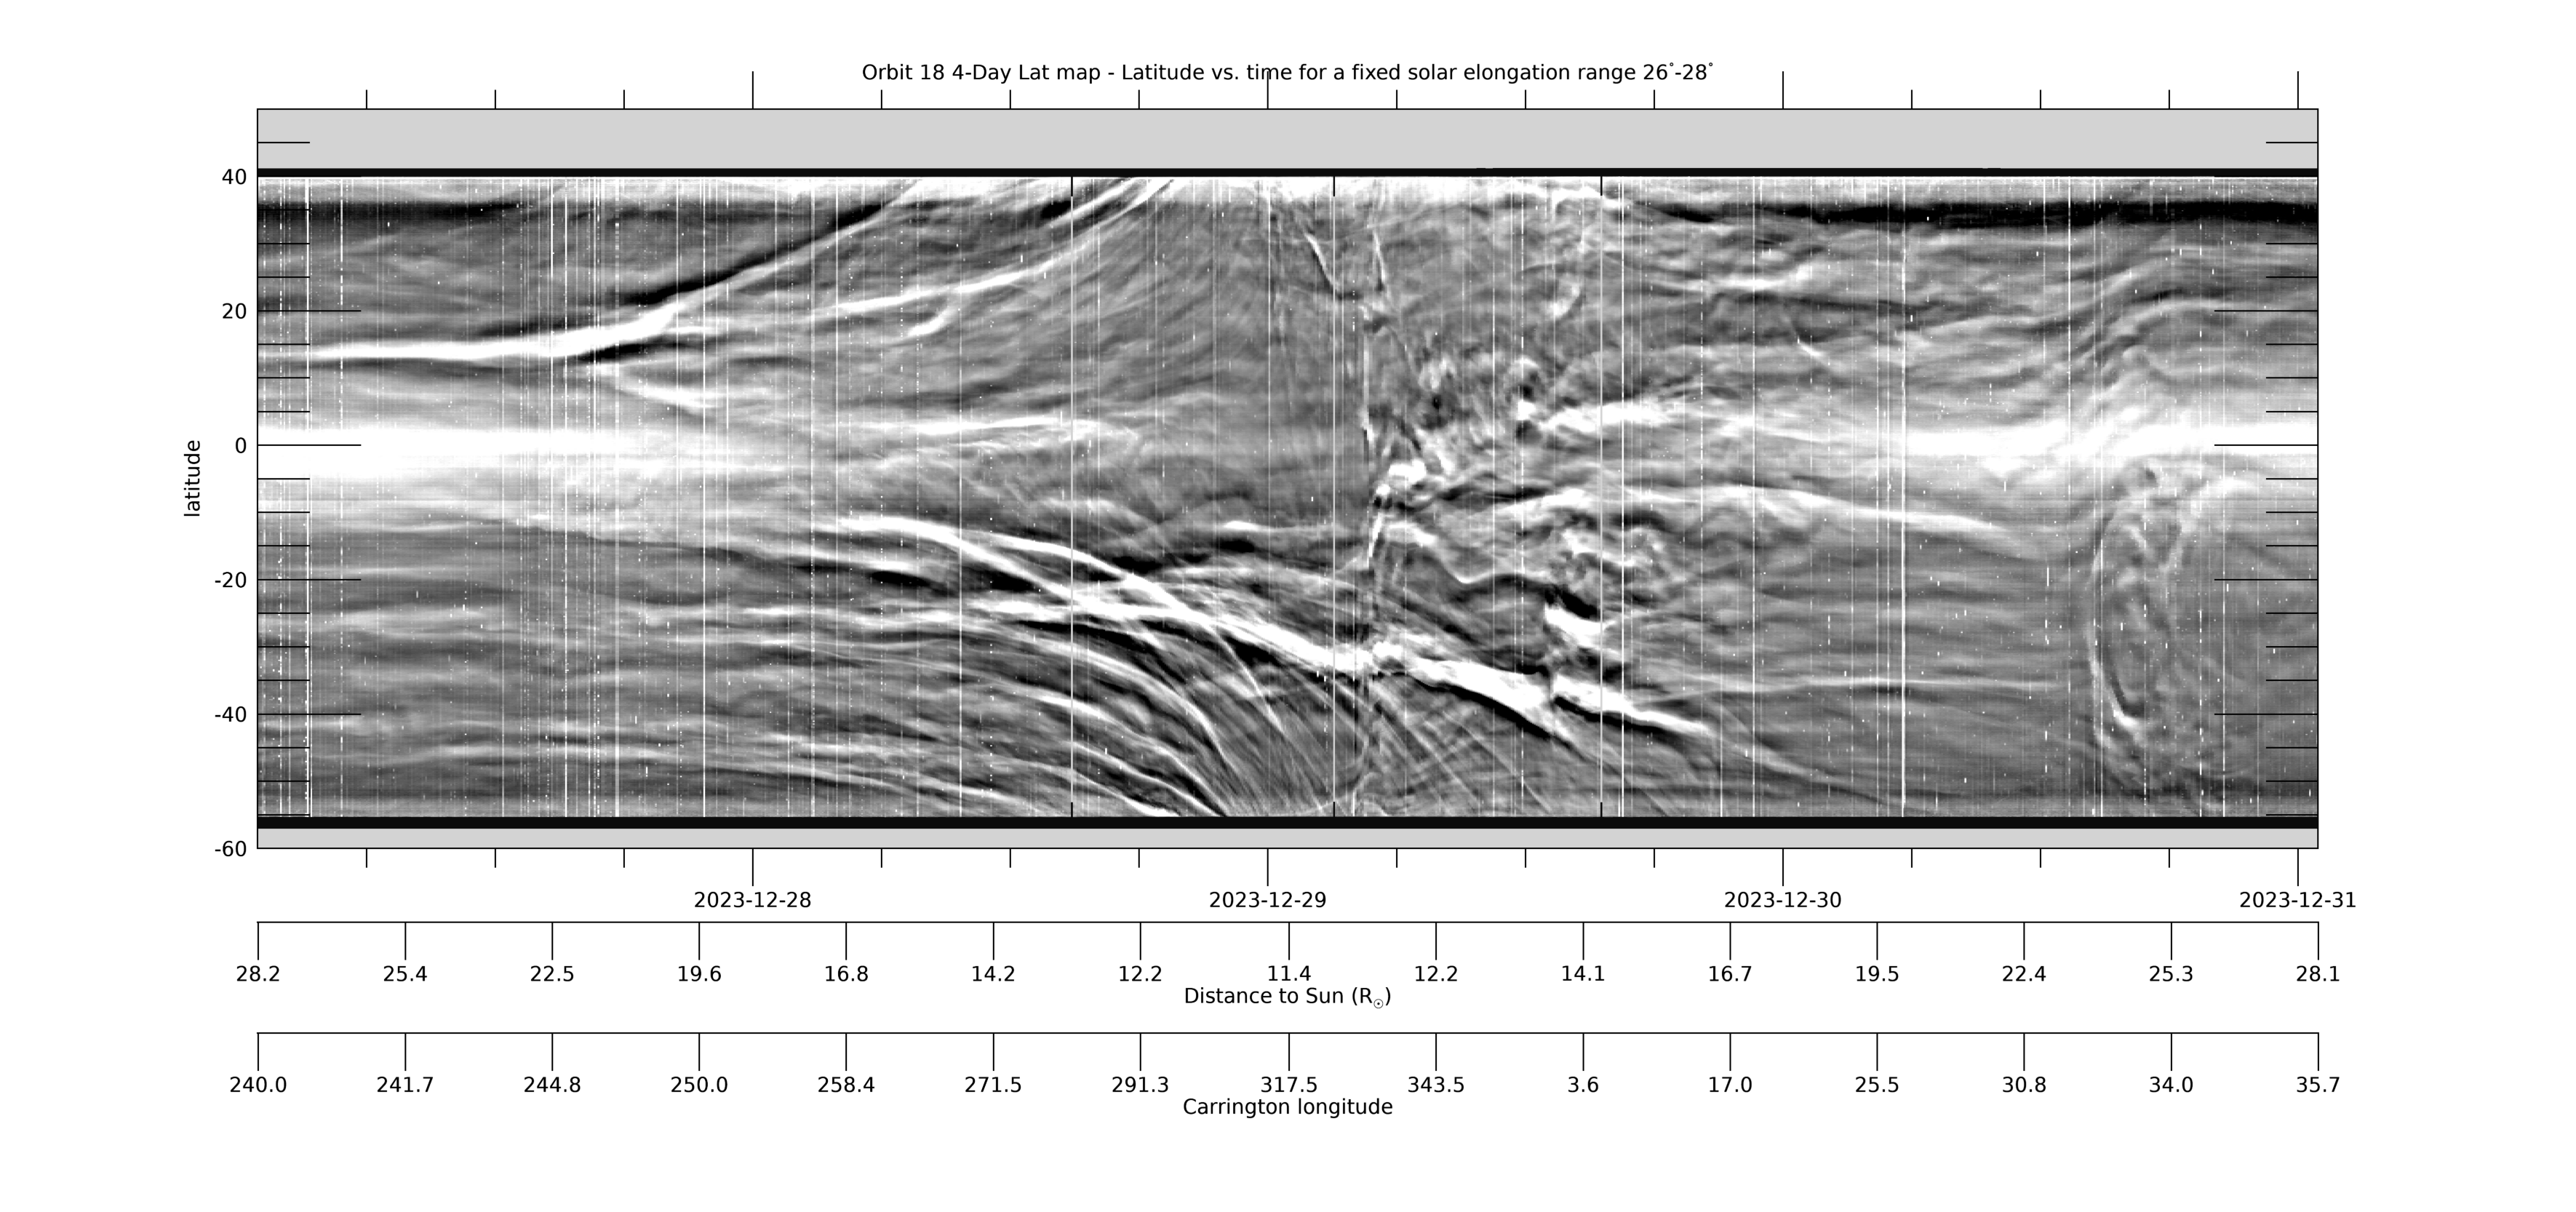
[ABOVE] This 4-day Lat-map shows the evolution in latitude, measured from the PSP-Venus orbit plane, for a fixed solar elongation of 26°-28°. The map is created from L3-processed images by collecting the arc of data in the WISPR-I FOV in the range 26°-28°elongation from each image and stacking the data horizontally in time (for details, see Liewer et al, 2023; DOI: 10.3847/1538-4357/acc8c7). Near perihelion when PSP is moving faster than the Sun rotates, quasi-stationary coronal rays may show large changes in apparent latitude as they approach and pass over or under the spacecraft. The map was created using L3 processed images. The L3 movies at this web site can be used to identify features seen in the Lat-map. [Credit: NASA/JPL. Data processed by Paulo Penteado (JPL/Caltech).]
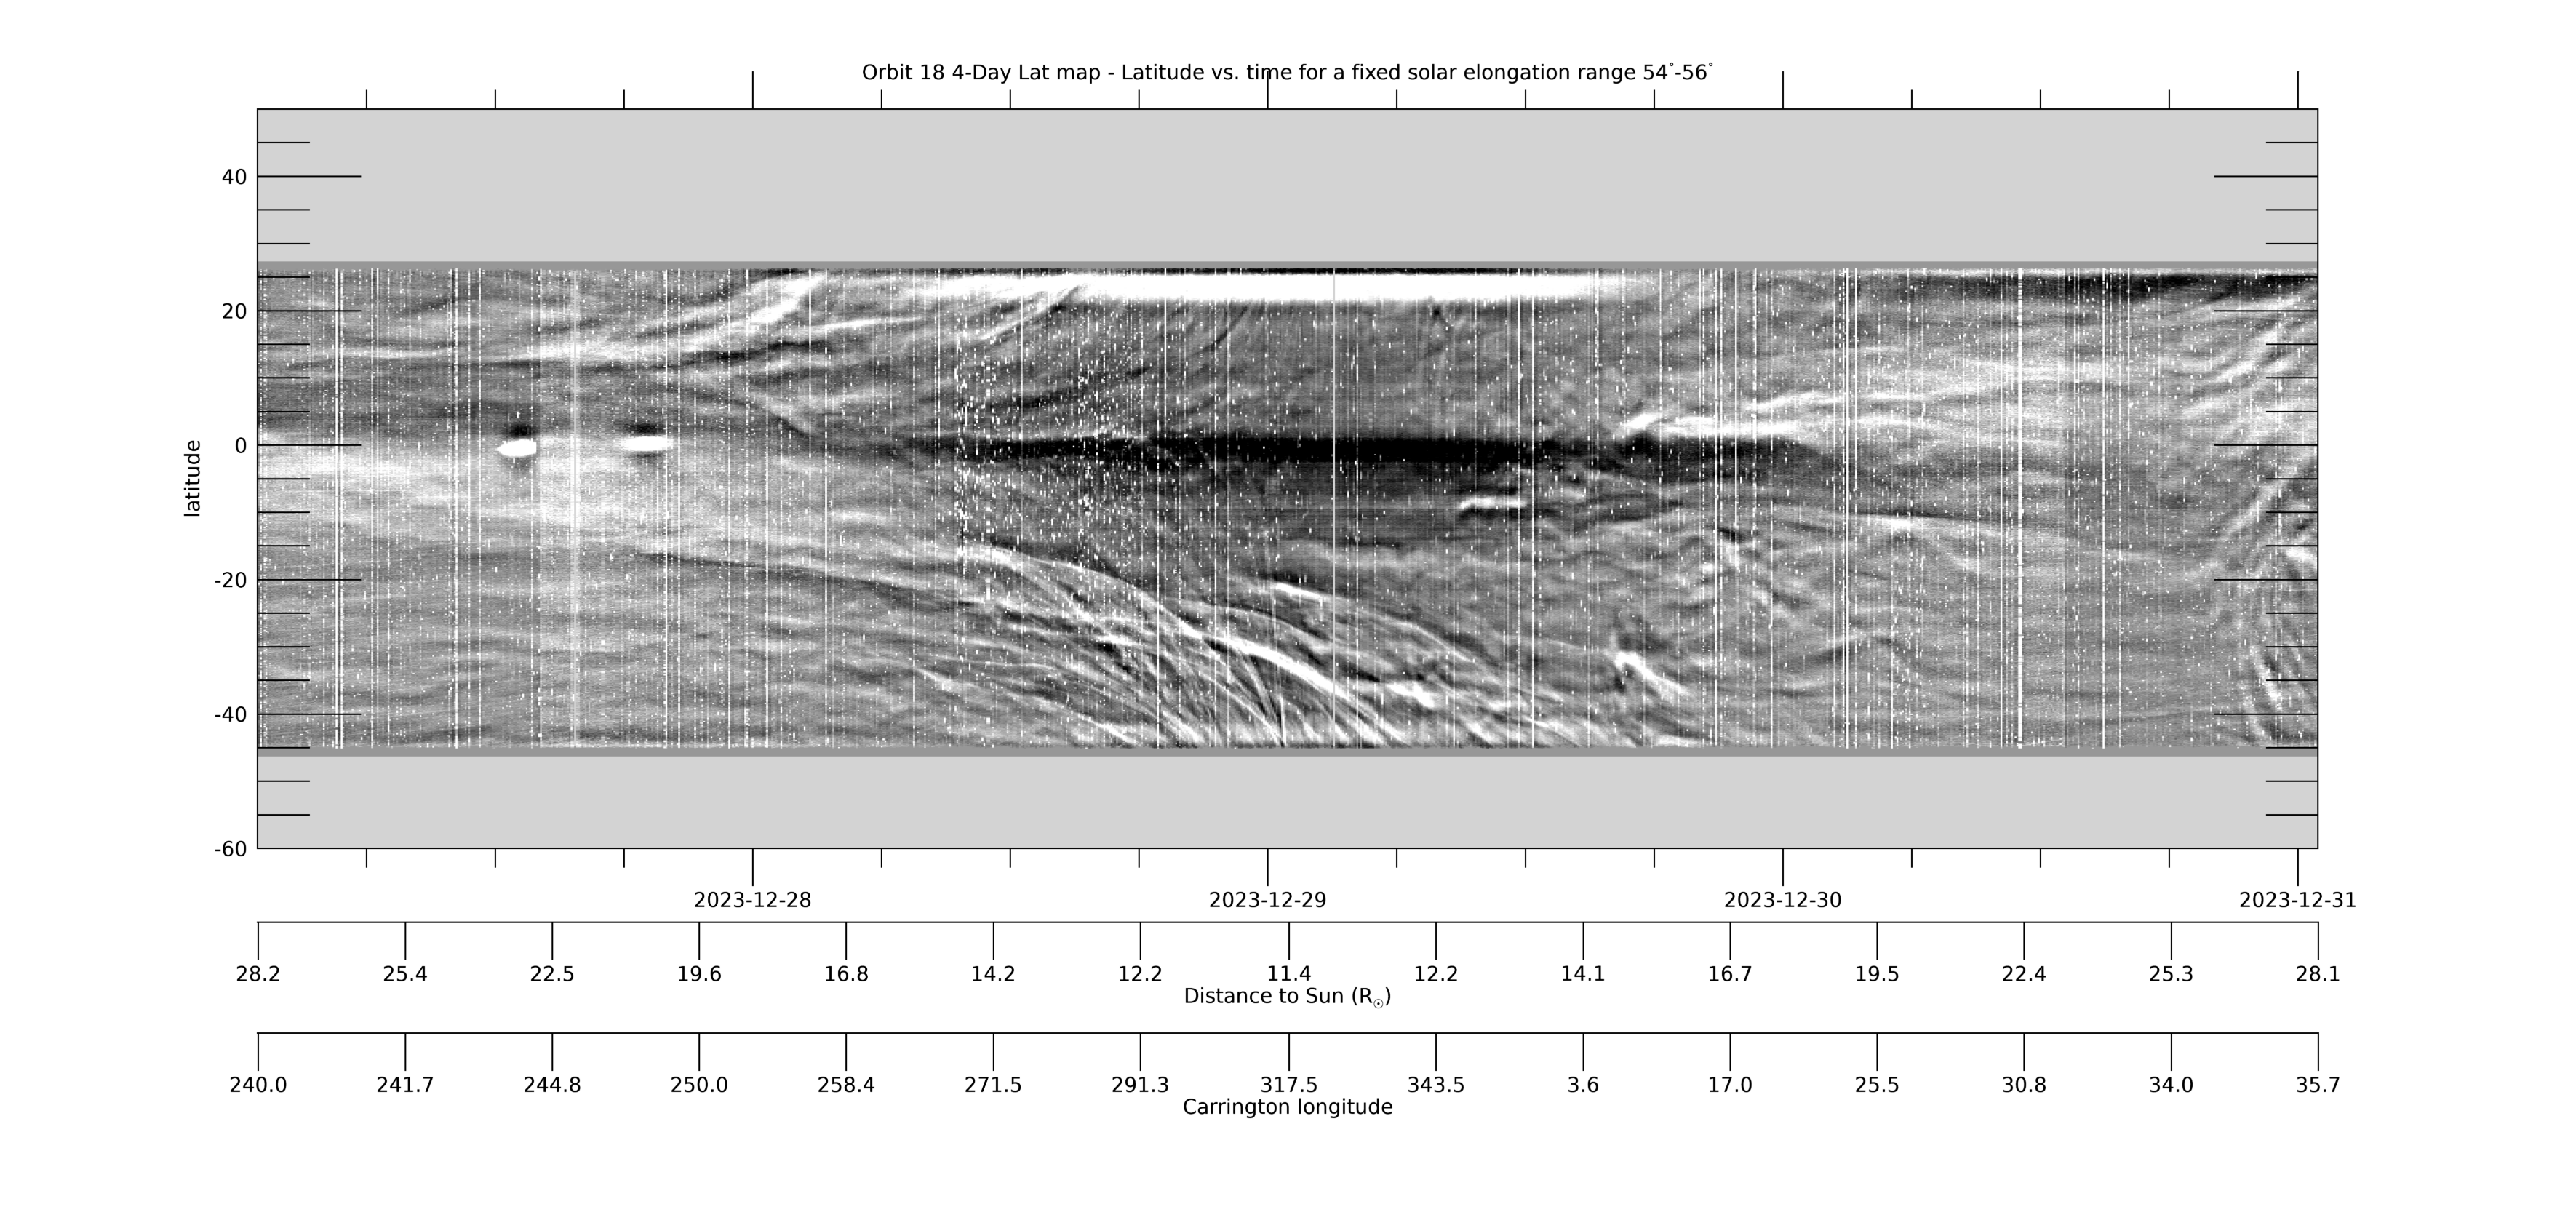
[ABOVE] This 4-day Lat-map shows the evolution in latitude, measured from the PSP-Venus orbit plane, by collecting the arc of data in the WISPR-O FOV for a fixed solar elongation range of 54°-56°. It is made in the same way as the WISPR-I Lat-map above. See that caption for more information. [Credit: NASA/JPL. Data processed by Paulo Penteado (JPL/Caltech).]
Released data for all encounters can be obtained from our WISPR Data Page. Descriptions of other encounters can be found on the Encounter Summaries Page.