Encounter 25 (2025-09-11 - 2025-09-20, with limited additional data 2025-08-18 - 2025-09-23)
This animation shows all L3 WISPR full-field observations from the twenty-second PSP Mission Encounter (2025-09-11 - 2025-09-20). We have superimposed a grid showing helioprojective longitude and latitude, and a scale representation of the size and location of the Sun in the observations using the SDO/HMI Carrington map for this time period. The velocity and distance metrics displayed on the movies correspond respectively to the spacecraft's heliocentric velocity in kilometers per second, and its distance from the Sun's center in units of solar radii (where 1 solar radius = 695,700km). The "FOV Range" label provides the plane-of-sky distance limits of the inner and outermost edges of the fields of view, in units of solar radii. The horizontal blue line indicates the orbital plane of PSP. The timespan of this composite movie covers only the nominal science window when the spacecraft was within 0.25 au; a limited amount of data outside of this range may be available at the below links.
You can download this movie directly as an 97MB mp4 file. This sequence is also available as data processed via the LW Algorithm developed by Dr. Guillermo Stenborg (JHUAPL) and detailed in Appendix A of Howard et al. 2022 (ApJ, 936, id.43. DOI 10.3847/1538-4357/ac7ff5). Please contact the team for access to this data, which will be posted here one year after the acquisition of those observations. Team contact information can be found in Section 1.2 of the WISPR User's Guide [PDF link].
[Credit: NASA/NRL/JHUAPL. Movie processed/compiled by Guillermo Stenborg (JHUAPL) and Karl Battams (NRL). SDO inset courtesy of NASA/SDO and the AIA, EVE, and HMI science teams.]
Solar Features
TBD
Comets and planets
A few Kreutz sungrazers are visible, along with two small "non-group" comets. Their exact identities still to be determined.
Planets as follows:
- TBD
Operations summary
Between August 18 and the beginning of the encounter, WISPR took advantage of extra telemetry to take additional images far outside of the nominal encounter distances, when there were potential overlaps with the fields of view of other instruments. These data have been released to the L1 and L2 level, but given the difficulty in providing a stable background over such large changes in radial distance, the team has not released backgrounds (L2b) or background-subtracted data products (L3 or LW). Anyone looking to do a more thorough science investigation during this period can contact the instrument team for assistance in processing these pre-encounter images.
Between October 18 and November 05, WISPR had an opportunity to observe the comet 3I/ATLAS. This was done using a moving subfield of the detector to capture the comet while limiting the amount of data required. These images are not standard WISPR images and cannot be used directly alongside the standard synoptic dataset. For more information see our 3I/ATLAS Data Page.
Between September 15 08:32 and September 16 09:28, an incorrect bias level was subtracted from the outer telescope L1 images, leaving a remnant column to column signal behind. This is similar to a problem that occurred in Encounter 10 and the higher level data products (L2, L3, and LW) have all been corrected in the same manner, removing the artifact.
Miscellaneous notes
None.
Encounter 25 Data Products
- Encounter 25 Level-2 FITS (19 GB zip file)
- Encounter 25 Level-2b FITS, Background Models (16 GB zip file)
- Encounter 25 Level-3 FITS (15 GB zip file)
- Encounter 25 L1 and L2 Summary Files (<1 MB zip file)
- Encounter 25 Level-3 PNGs, Inner camera (1.6 GB zip file)
- Encounter 25 Level-3 PNGs, Outer camera (1.9 GB zip file)
- Encounter 25, Inner mpg, 480x512px (50 MB)
- Encounter 25, Inner mpg, 960x1024px (323 MB)
- Encounter 25, Outer mpg, 480x512px (214 MB)
- Encounter 25, Outer mpg, 960x1024px (1.1GB)
- Encounter 25, Inner mvi, 480x512px (539 MB)
- Encounter 25, Inner mvi, 960x1024px (2.2 GB)
- Encounter 25, Outer mvi, 480x512px (494 MB)
- Encounter 25, Outer mvi, 960x1024px (2.0 GB)
Encounter 25 J-maps, R-maps, and Lat-maps
The following data products are J-maps, R-maps, and Lat-maps for this Encounter, provided by NASA/JPL/CALTECH. Some reference on the use and interpretation of elongation versus time maps (aka J-maps) are Sheeley et al., 1999 ( DOI: 10.1029/1999JA900308), Sheeley et al., 2008 ( DOI: 10.1086/529020) and Rouillard et al., 2010 ( DOI: 10.1029/2009JA014472). A reference for the creation and use of R-maps is Nindos et al., 2021 (DOI: 10.1051/0004-6361/202039414). Various ways of constructing Latitude versus Time maps are described in Poirier et al., 2020 (DOI: 10.3847/1538-4365/ab6324), Nindos et al., 2021 (DOI: 10.1051/0004-6361/202039414), and Liewer et al., 2023 (DOI: /10.3847/1538-4357/acc8c7).
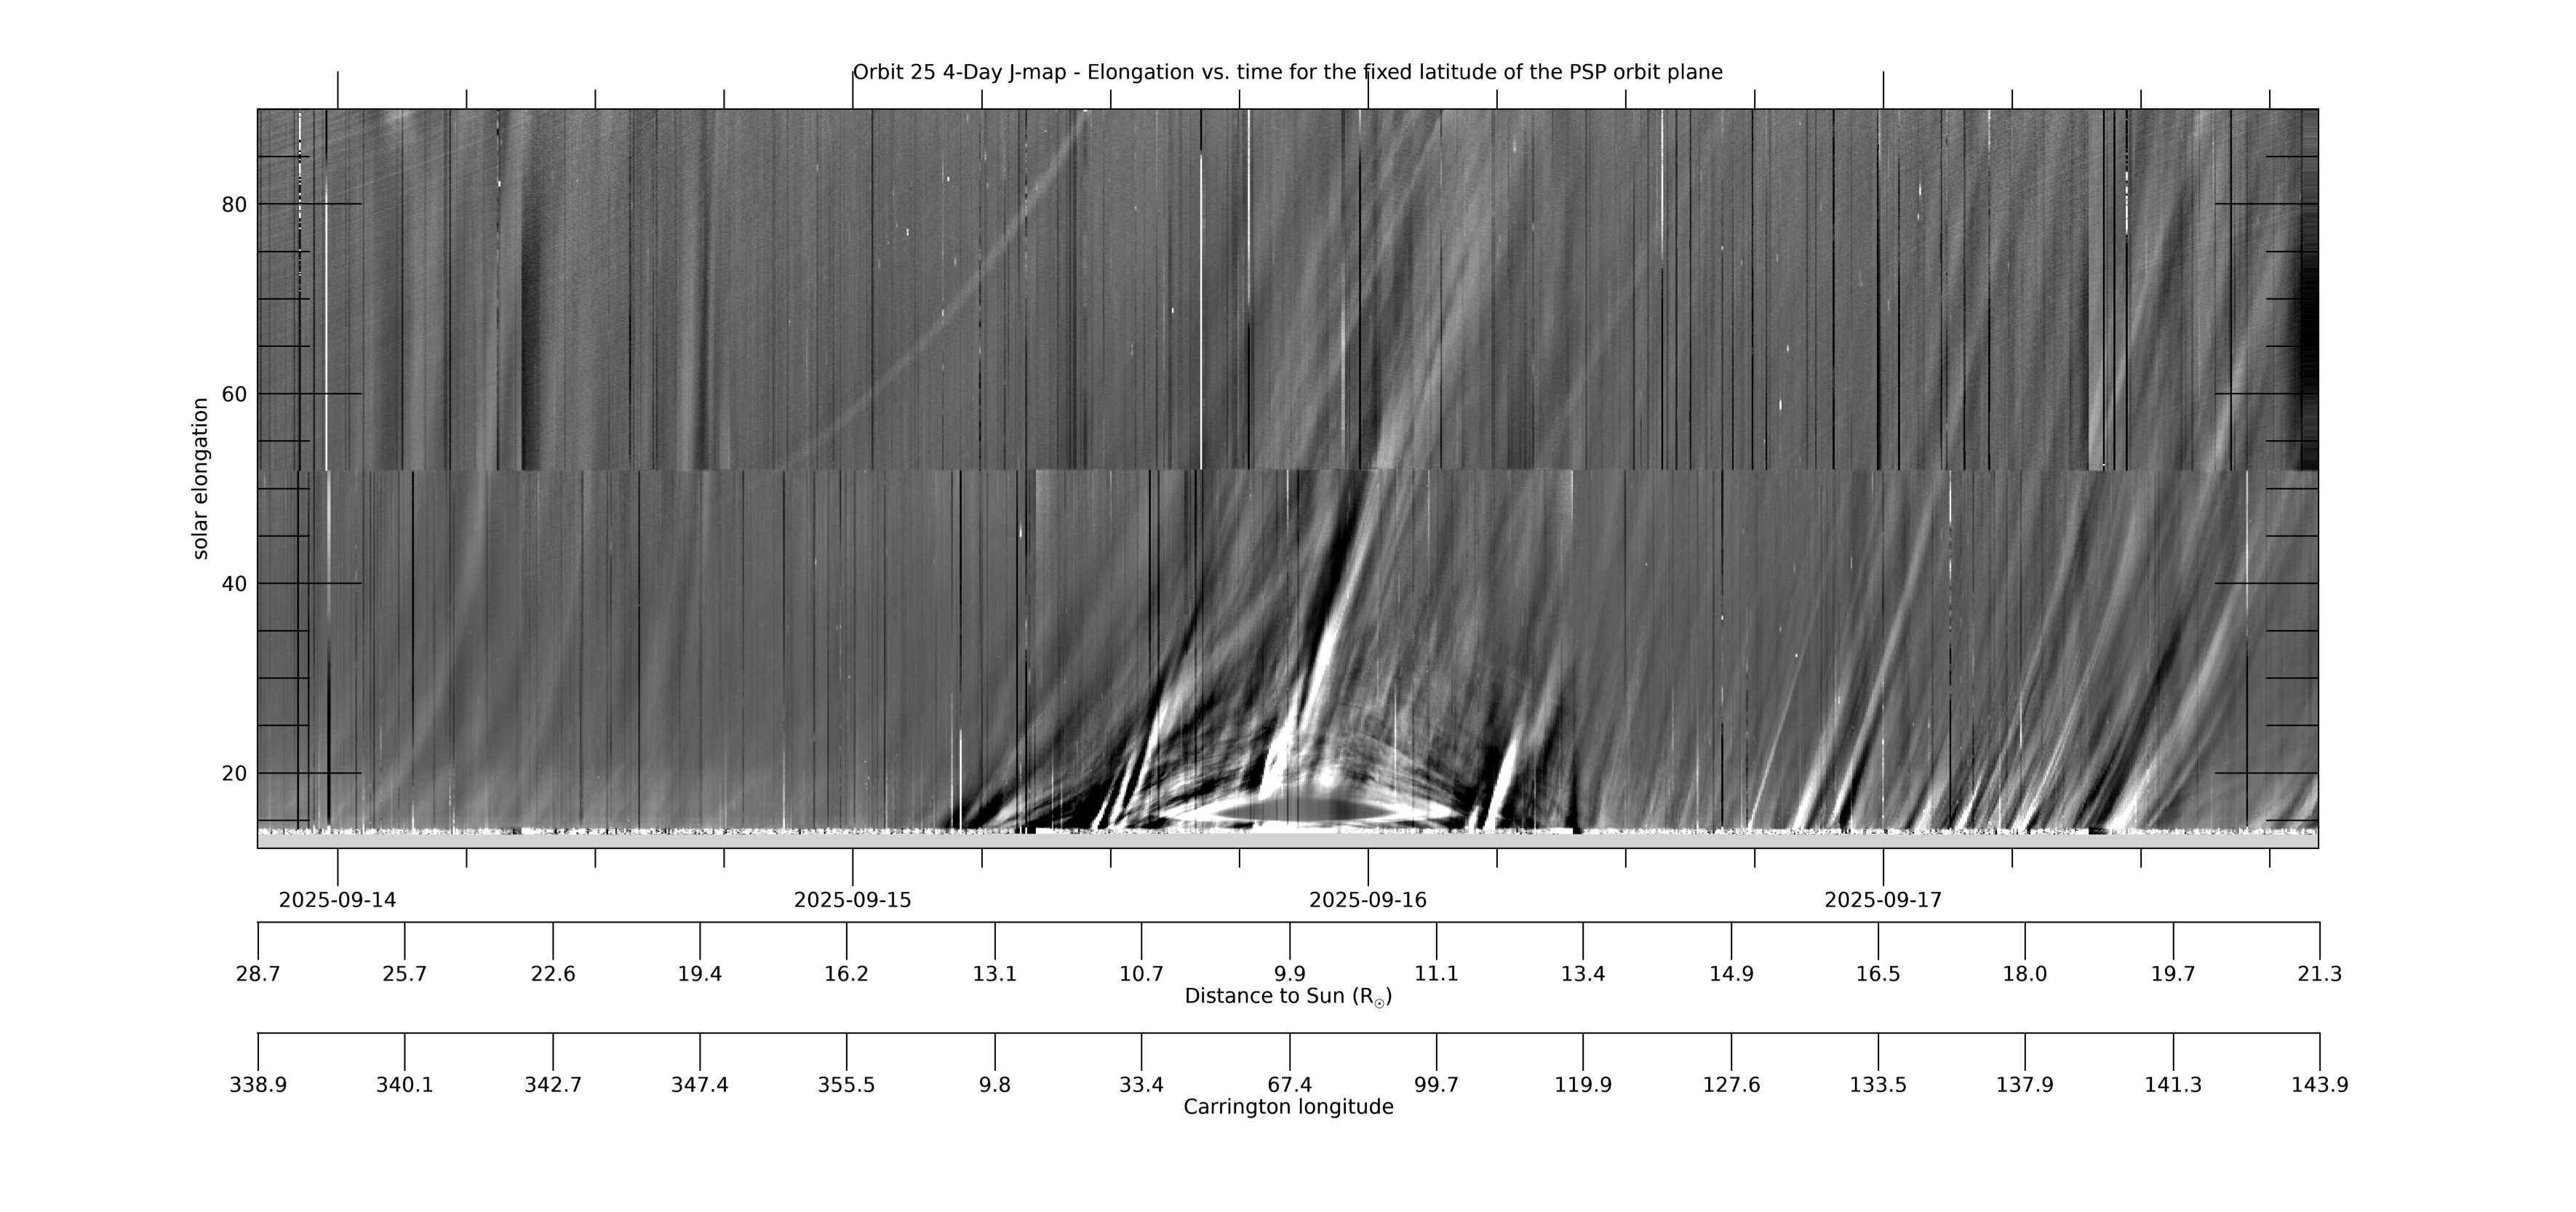
[ABOVE] This 4-day WISPR J-map shows solar elongation (angle from the Sun center) versus time at a fixed latitude measured relative to the PSP-Venus orbit plane. It is created from composite LW-processed full field-of-view (FOV) composite images such as those in the LW movie above, in which the PSP-Venus orbit plane is marked with a blue line. For each image (each time), data is collected along the PSP-Venus orbit plane for the full range of elongations in the WISPR FOV. The collected data is then stacked in time (x-axis) with elongation as the y-axis. The WISPR movies at this web site can be used to identify and find the cause of the various features seen in the J-map. Below the time axis are two additional axes showing PSP’s distance to the Sun RP and its Carrington longitude at that time. The time span in this and subsequent maps is centered on the time of perihelion. [Credit: NASA/JPL. Data processed by Paulo Penteado (JPL/Caltech).]
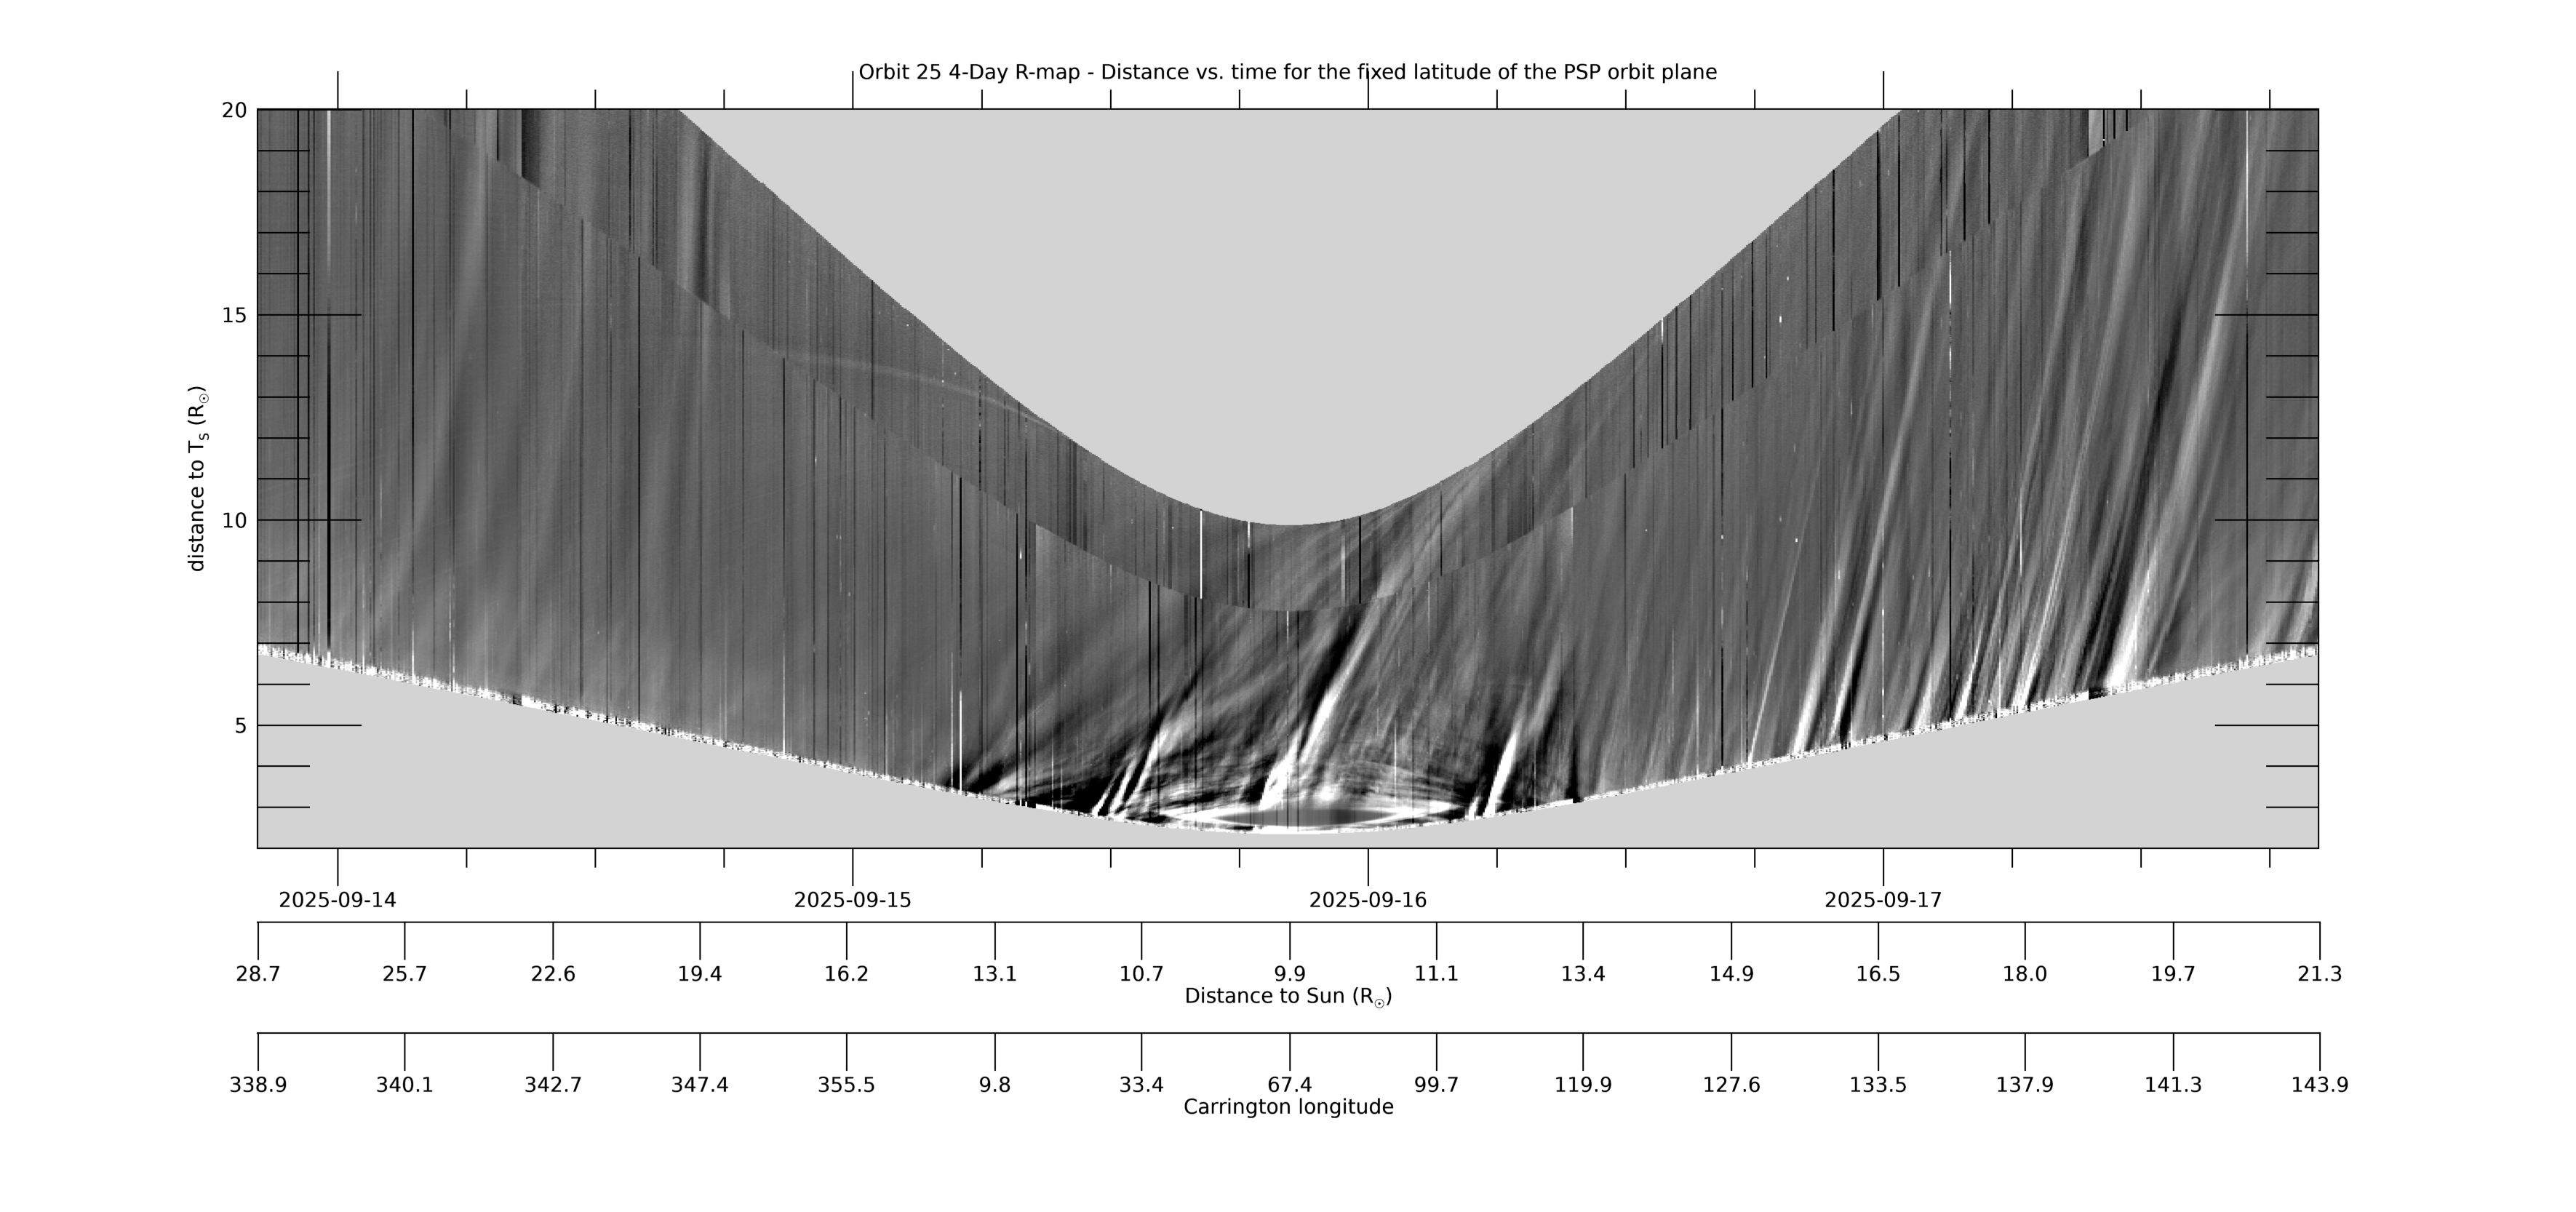
[ABOVE] This 4-day R-map uses the same data as the 4-day J-map (the data collected at each time/image along the PSP-Venus orbit plane), but makes the assumption that the (line-of-sight integrated) signal at each solar elongation all comes from where that line-of-sight hits the Thomson sphere, which is the location of maximum sensitivity of a white light telescope (see, e.g., Vourlidas & Howard, 2006, ApJ,642,1216; DOI: 10.1086/501122). This distance RT (the new y-axis) is related to the elongation by RT=RP*sin(elongation), where RP is PSP’s distance to the Sun. The R-map can be considered a “height-time” plot with and such maps can be used to estimate of the velocity of the observed transients. The LW composite movie above can be used to identify and find the cause of the various features seen in the R-map. Only data up to 90° has been included. [Credit: NASA/JPL. Data processed by Paulo Penteado (JPL/Caltech).]
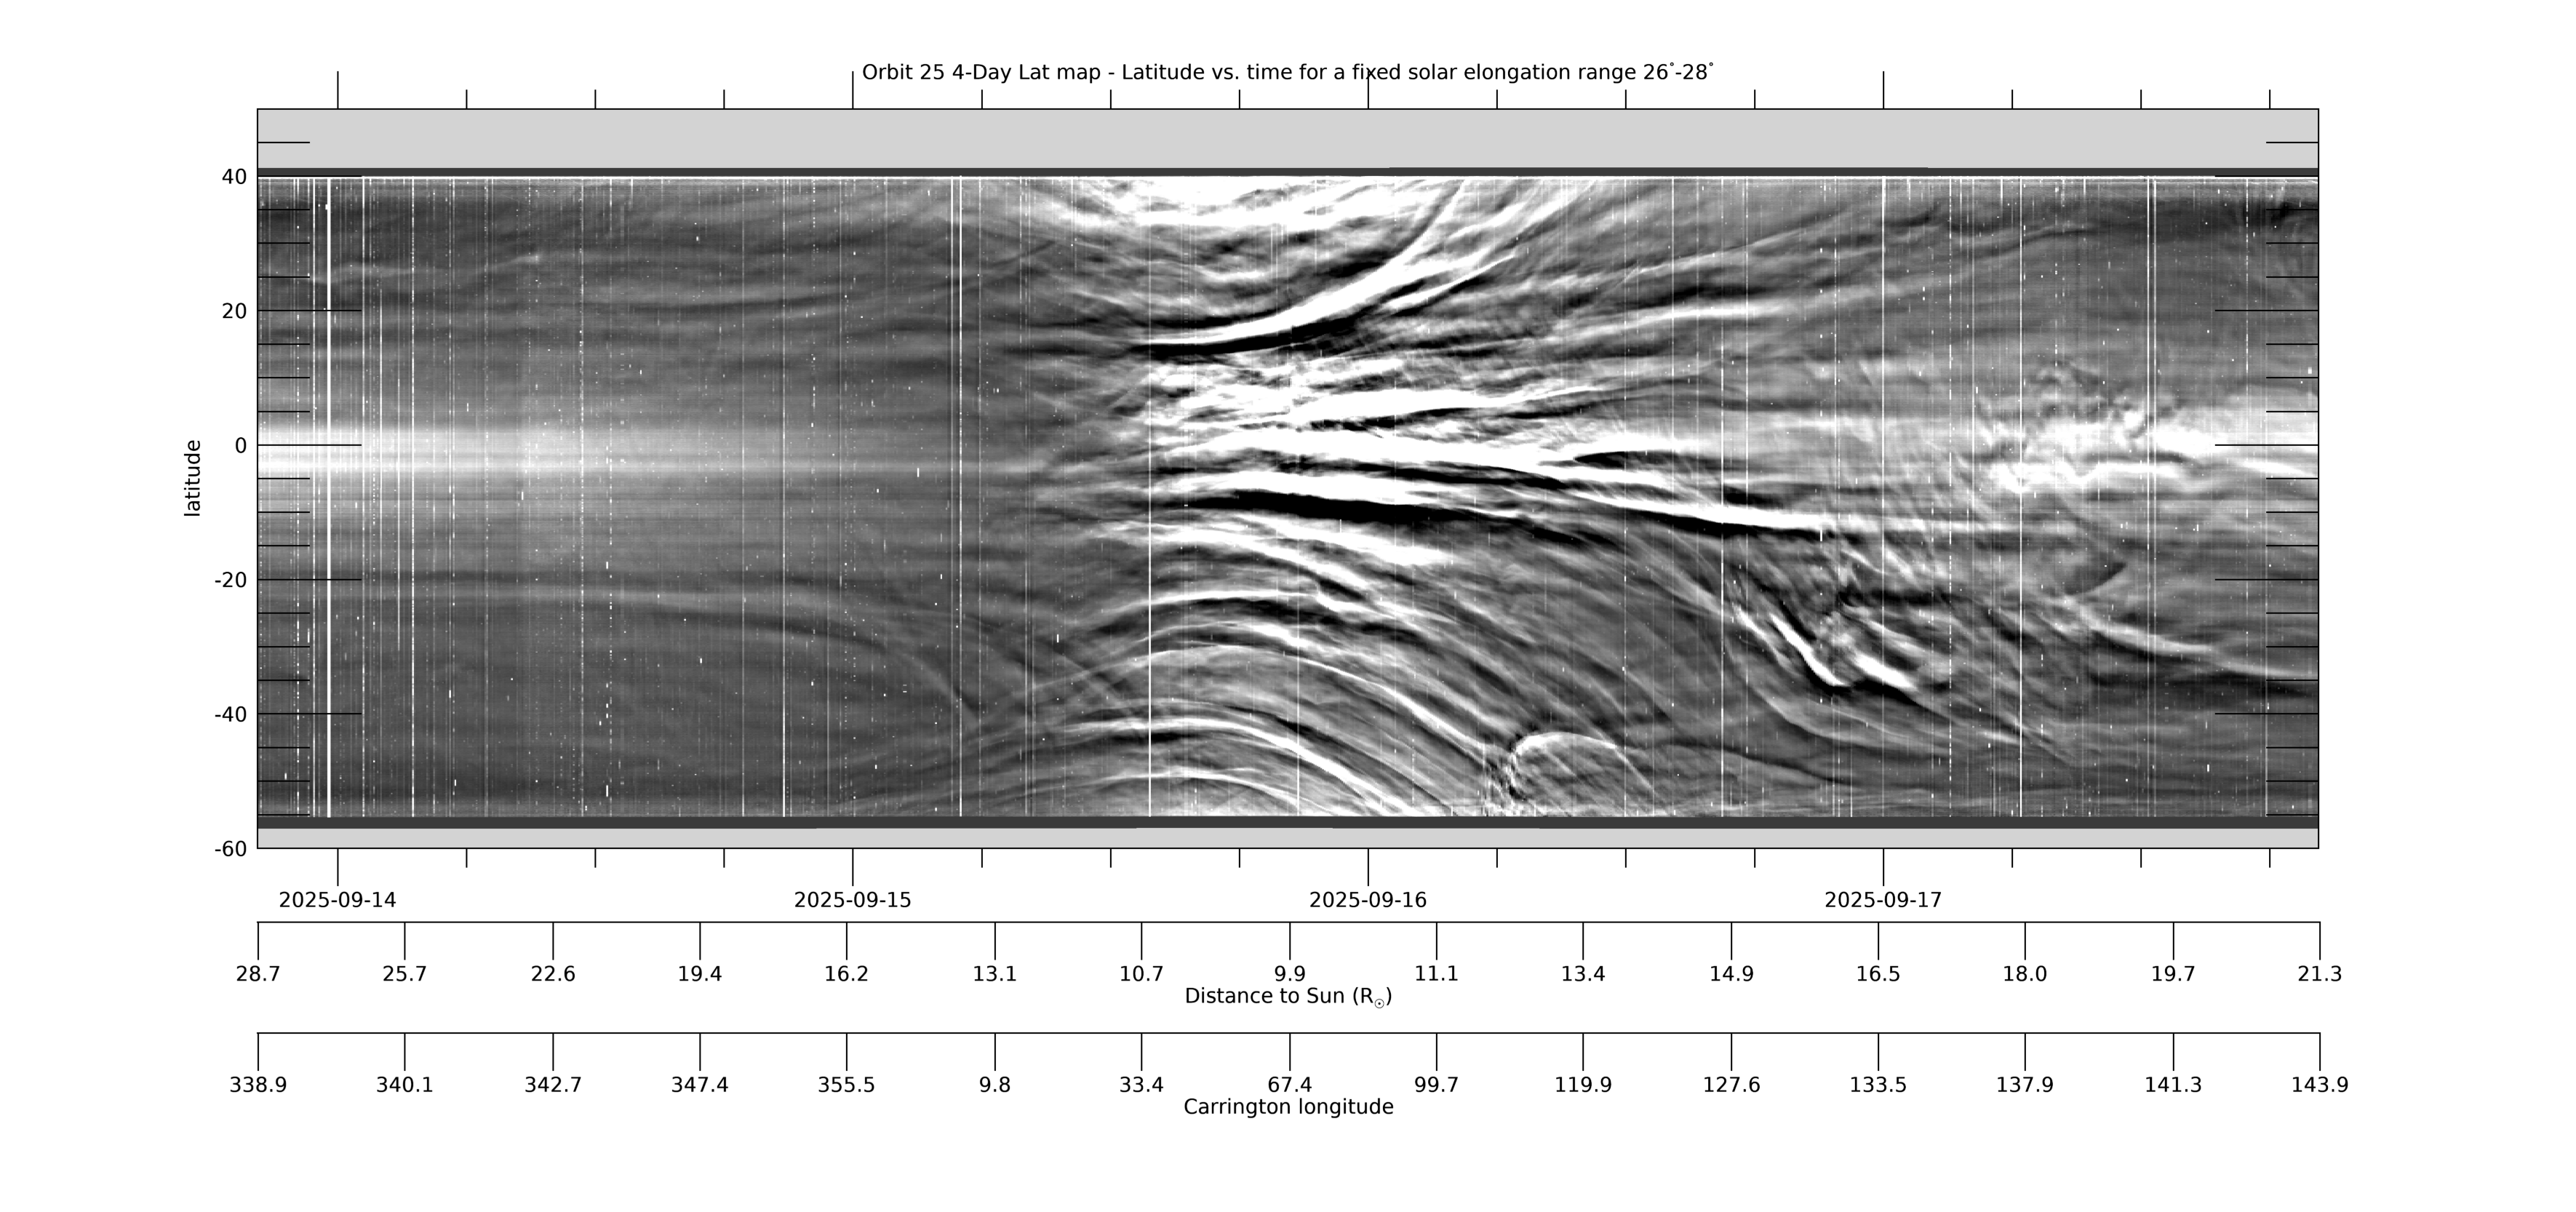
[ABOVE] This 4-day Lat-map shows the evolution in latitude, measured from the PSP-Venus orbit plane, for a fixed solar elongation of 26°-28°. The map is created from L3-processed images by collecting the arc of data in the WISPR-I FOV in the range 26°-28°elongation from each image and stacking the data horizontally in time (for details, see Liewer et al, 2023; DOI: 10.3847/1538-4357/acc8c7). Near perihelion when PSP is moving faster than the Sun rotates, quasi-stationary coronal rays may show large changes in apparent latitude as they approach and pass over or under the spacecraft. The map was created using L3 processed images. The L3 movies at this web site can be used to identify features seen in the Lat-map. [Credit: NASA/JPL. Data processed by Paulo Penteado (JPL/Caltech).]
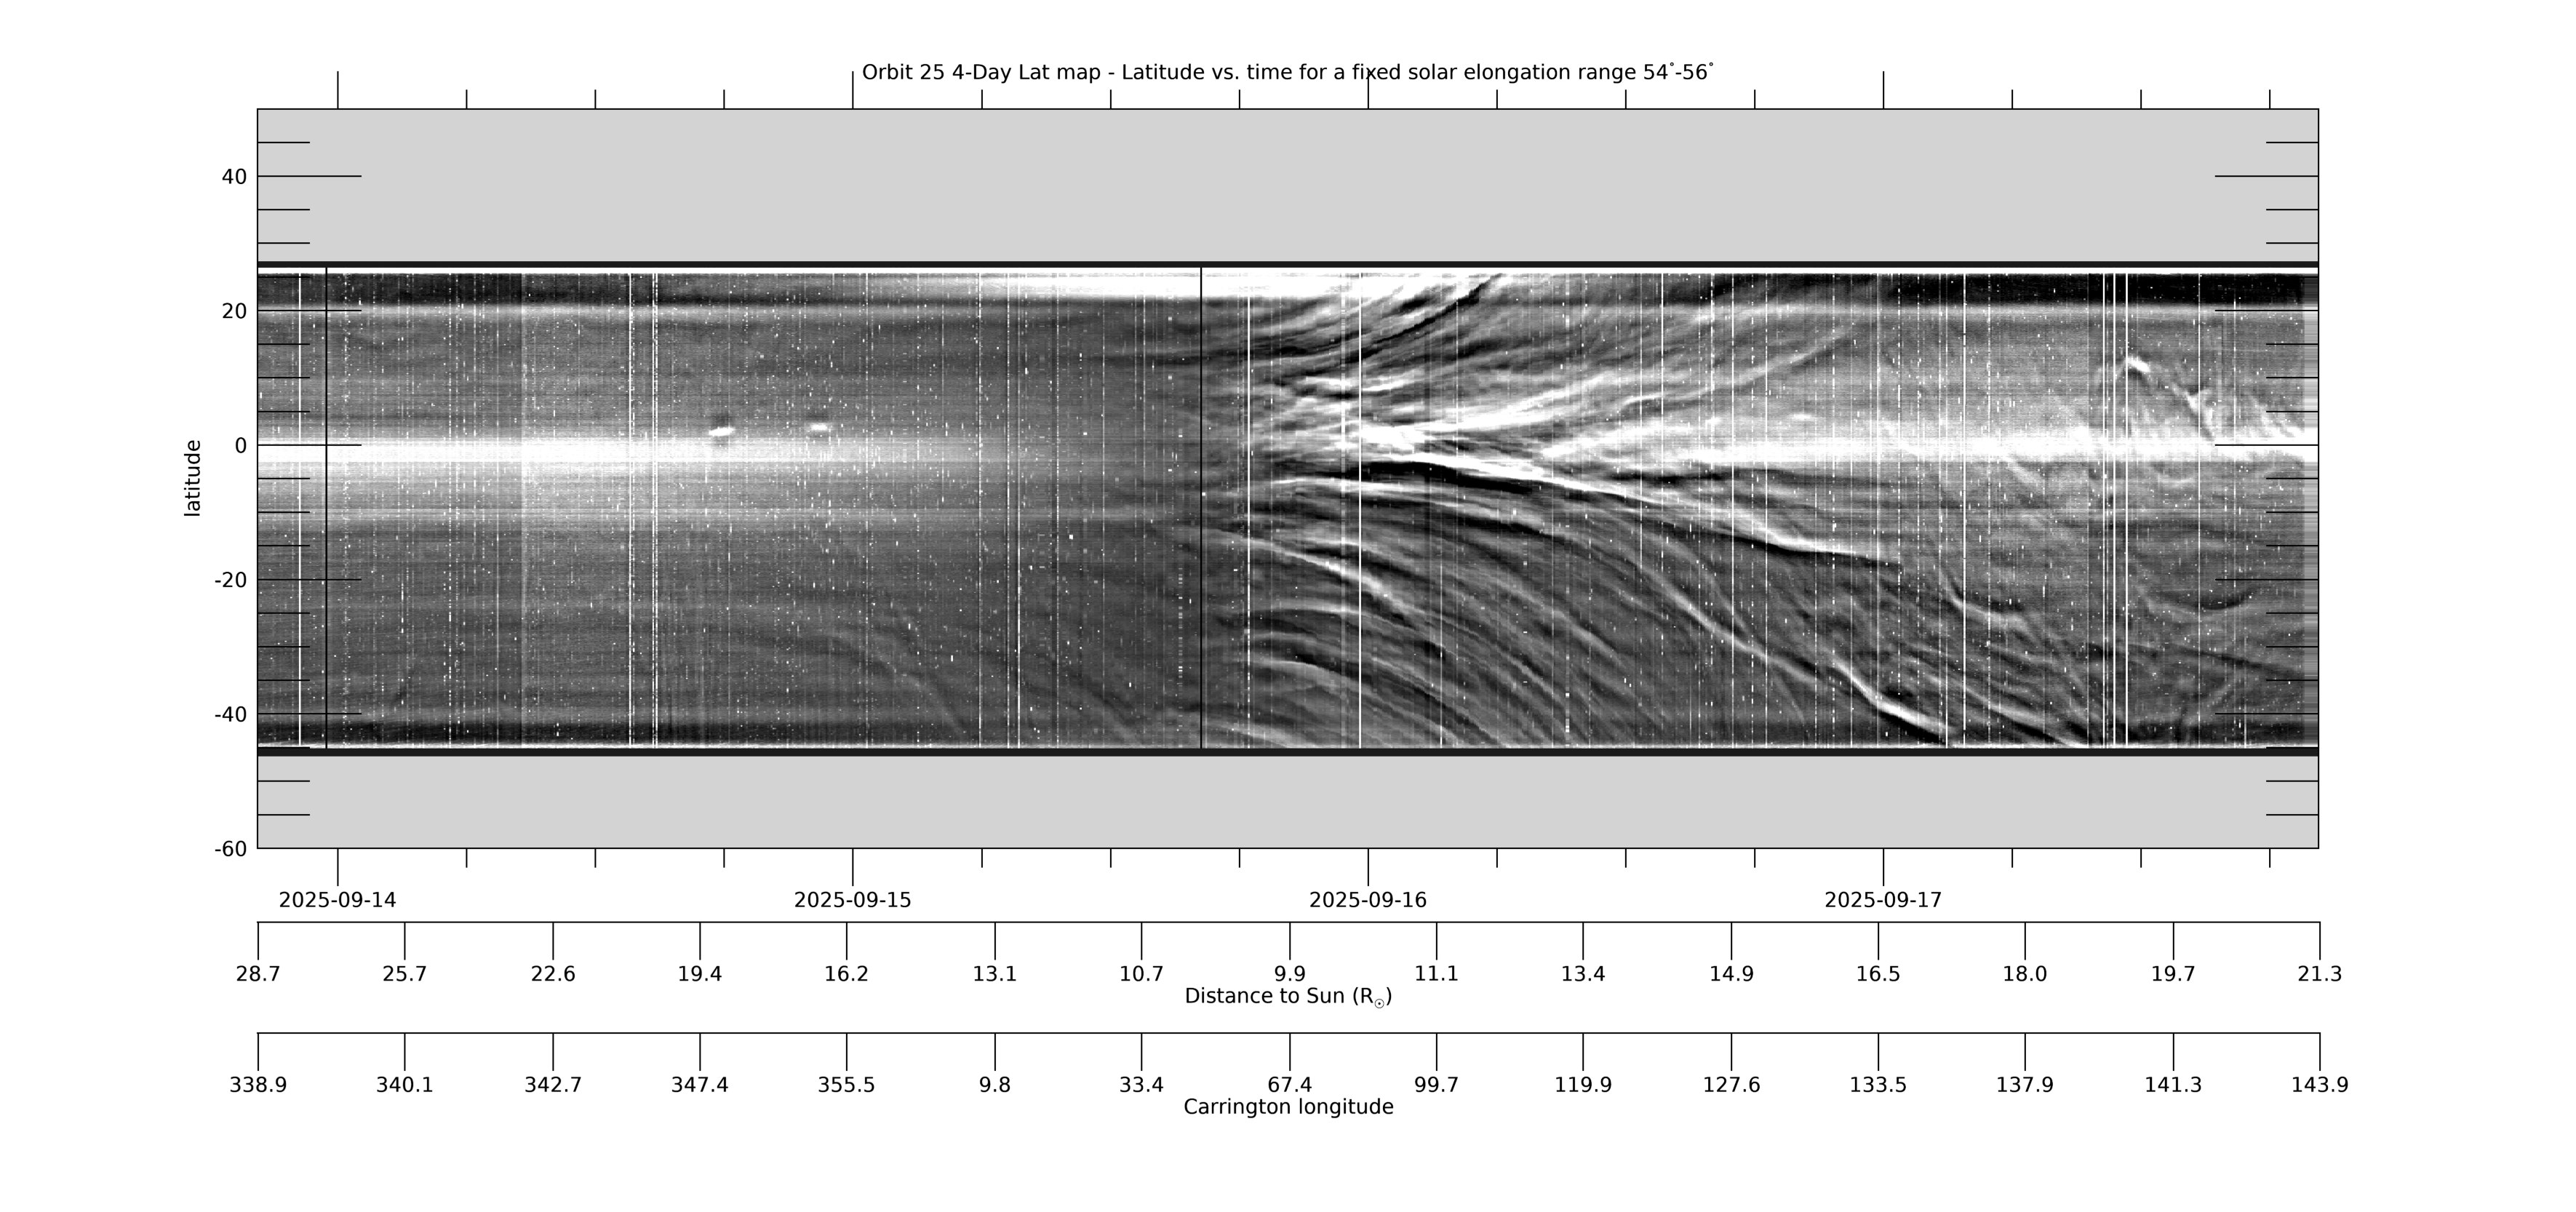
[ABOVE] This 4-day Lat-map shows the evolution in latitude, measured from the PSP-Venus orbit plane, by collecting the arc of data in the WISPR-O FOV for a fixed solar elongation range of 54°-56°. It is made in the same way as the WISPR-I Lat-map above. See that caption for more information. [Credit: NASA/JPL. Data processed by Paulo Penteado (JPL/Caltech).]
Released data for all encounters can be obtained from our WISPR Data Page. Descriptions of other encounters can be found on the Encounter Summaries Page.