Encounter 6 (2020-09-19 - 2020-10-13, with limited additional data 2020-08-08 - 2020-10-31)
This animation shows all WISPR full-field observations from the sixth PSP Mission Encounter (2020-09-21 - 2020-10-22), using L3 observations. We have superimposed a grid showing helioprojective longitude and latitude, and a scale representation of the size and location of the Sun in the observations using the SDO/HMI Carrington map for this time period. The velocity and distance metrics displayed on the movies correspond respectively to the spacecraft's heliocentric velocity in kilometers per second, and its distance from the Sun's center in units of solar radii (where 1 solar radius = 695,700km). The "FOV Range" label provides the plane-of-sky distance limits of the inner and outermost edges of the fields of view, in units of solar radii. The horizontal blue line indicates the orbital plane of PSP. The timespan of this composite movie covers only the nominal science window when the spacecraft was within 0.25 au; a limited amount of data outside of this range may be available at the below links.
You can also download this movie directly as a 42MB mp4 file. It is also available in the same format processed via the LW Algorithm developed by Dr. Guillermo Stenborg (JHUAPL) and detailed in Appendix A of Howard et al. 2022 (ApJ, 936, id.43. DOI 10.3847/1538-4357/ac7ff5), and can be downloaded here as a 175MB mp4 file.
[Credit: NASA/NRL/JHUAPL. Movie processed/compiled by Guillermo Stenborg (JHUAPL) and Brendan Gallagher (NRL). SDO inset courtesy of NASA/SDO and the AIA, EVE, and HMI science teams.]
Solar Features
2020-09-26 08:07 Streamer Blob
2020-09-27 00:39 Streamer Blob
2020-09-28 00:06 Streamer Blob
2020-09-29 03:17 Streamer Blob
2020-09-29 10:45 Streamer Blob
2020-10-01 10:16 Streamer Blob
Comets and planets
The following comets were observed during this encounter. Note that some of the data sets occur outside the nominal Encounter window and, in many cases, the spacecraft may have a non-standard roll orientation. Thus only limited observations would have been made for the comet in question. If you have trouble locating the comets in any of these data or questions regarding the proper treatment of the comet observation data, please contact the WISPR comet observation coordinator, Karl Battams - karl.battams[at]nrl.navy.mil.
- September 13-14, 2020: Kreutz sungrazer "SOHO-4063" (Related NASA Press Release)
The following planets can be seen in the nominal encounter sequence movie (above), moving from left to right:
- TBD
Operations summary
- TBD
Miscellaneous notes
Upon analysis of our Encounter 6 observations, we noted an anomalous, excess global brightness in the images from both telescopes in the time period between the beginning of September 26th until around noon on the 27th. The source of this anomalous brightening could not be identified yet (i.e., whether K-corona or dust related, instrumental, etc.). As a result, the processed L3 observations for this time period do not look as “clean” as for previous encounters, in particular for the inner camera.
Moreover, in order to collect more photons per exposure, a different gain setting was exercised in the images of the inner telescope during a few days around perihelion, which causes the signal to noise ratio of the images to be different between the sets obtained with different gain settings. This also affected the quality of the background scene in the processed L3 observations.
Thus, for this encounter and for the Inner camera only, we are providing, in addition to the standard L3 products (i.e., fits files, Level-3 PNGs, MVI, and MPG files), a new Level-3 data variant. The standard L3 version consists basically of the difference between the L2 data products and their respective L2b backgrounds, corrected by the instrumental artifacts. The new L3 "ratio" variant accounts for the background removal instead by considering the ratio between the L2 and L2b data products, also corrected by the instrumental artifacts. The L3 “ratio” variant performs better at displaying the K-corona variability and background scene, hence their release.
We are continuing to evaluate these observations to identify the source behind the excess brightness, and will provide updates as we have them.
Encounter 6 Data Products
- Encounter 6 Level-2 FITS (11 Gb zip file)
- Encounter 6 Level-2 FITS, Background Models (7.3 Gb zip file)
- Encounter 6 Level-3 FITS (, "difference" and "ratio" data, 7.6 Gb zip file)
- Encounter 6 L2 Summary Files (<1 MB zip file)
- Encounter 6 Level-3 PNGs, Inner camera (176 MB zip file)
- Encounter 6 Level-3 "Ratio" PNGs, Inner camera (179 MB zip file)
- Encounter 6 Level-3 PNGs, Outer camera (128 MB zip file)
- Encounter 6, Inner mpg, 480x512px (64 MB)
- Encounter 6, Inner mpg, 960x1024px (362 MB)
- Encounter 6, Inner (Ratio) mpg, 480x512px (85 MB)
- Encounter 6, Inner (Ratio) mpg, 960x1024px (465 MB)
- Encounter 6, Outer mpg, 480x512px (79 MB)
- Encounter 6, Outer mpg, 960x1024px (414 MB)
- Encounter 6, Inner mvi, 480x512px (232 MB)
- Encounter 6, Inner mvi, 960x1024px (929 MB)
- Encounter 6, Inner (Ratio) mvi, 480x512px (232 MB)
- Encounter 6, Inner (Ratio) mvi, 960x1024px (929 MB)
- Encounter 6, Outer mvi, 480x512px (156 MB)
- Encounter 6, Outer mvi, 960x1024px (623 MB)
Encounter 06 J-maps, R-maps, and Lat-maps
The following data products are J-maps, R-maps, and Lat-maps for this Encounter, provided by NASA/JPL/CALTECH. Some reference on the use and interpretation of elongation versus time maps (aka J-maps) are Sheeley et al., 1999 ( DOI: 10.1029/1999JA900308), Sheeley et al., 2008 ( DOI: 10.1086/529020) and Rouillard et al., 2010 ( DOI: 10.1029/2009JA014472). A reference for the creation and use of R-maps is Nindos et al., 2021 (DOI: 10.1051/0004-6361/202039414). Various ways of constructing Latitude versus Time maps are described in Poirier et al., 2020 (DOI: 10.3847/1538-4365/ab6324), Nindos et al., 2021 (DOI: 10.1051/0004-6361/202039414), and Liewer et al., 2023 (DOI: /10.3847/1538-4357/acc8c7).
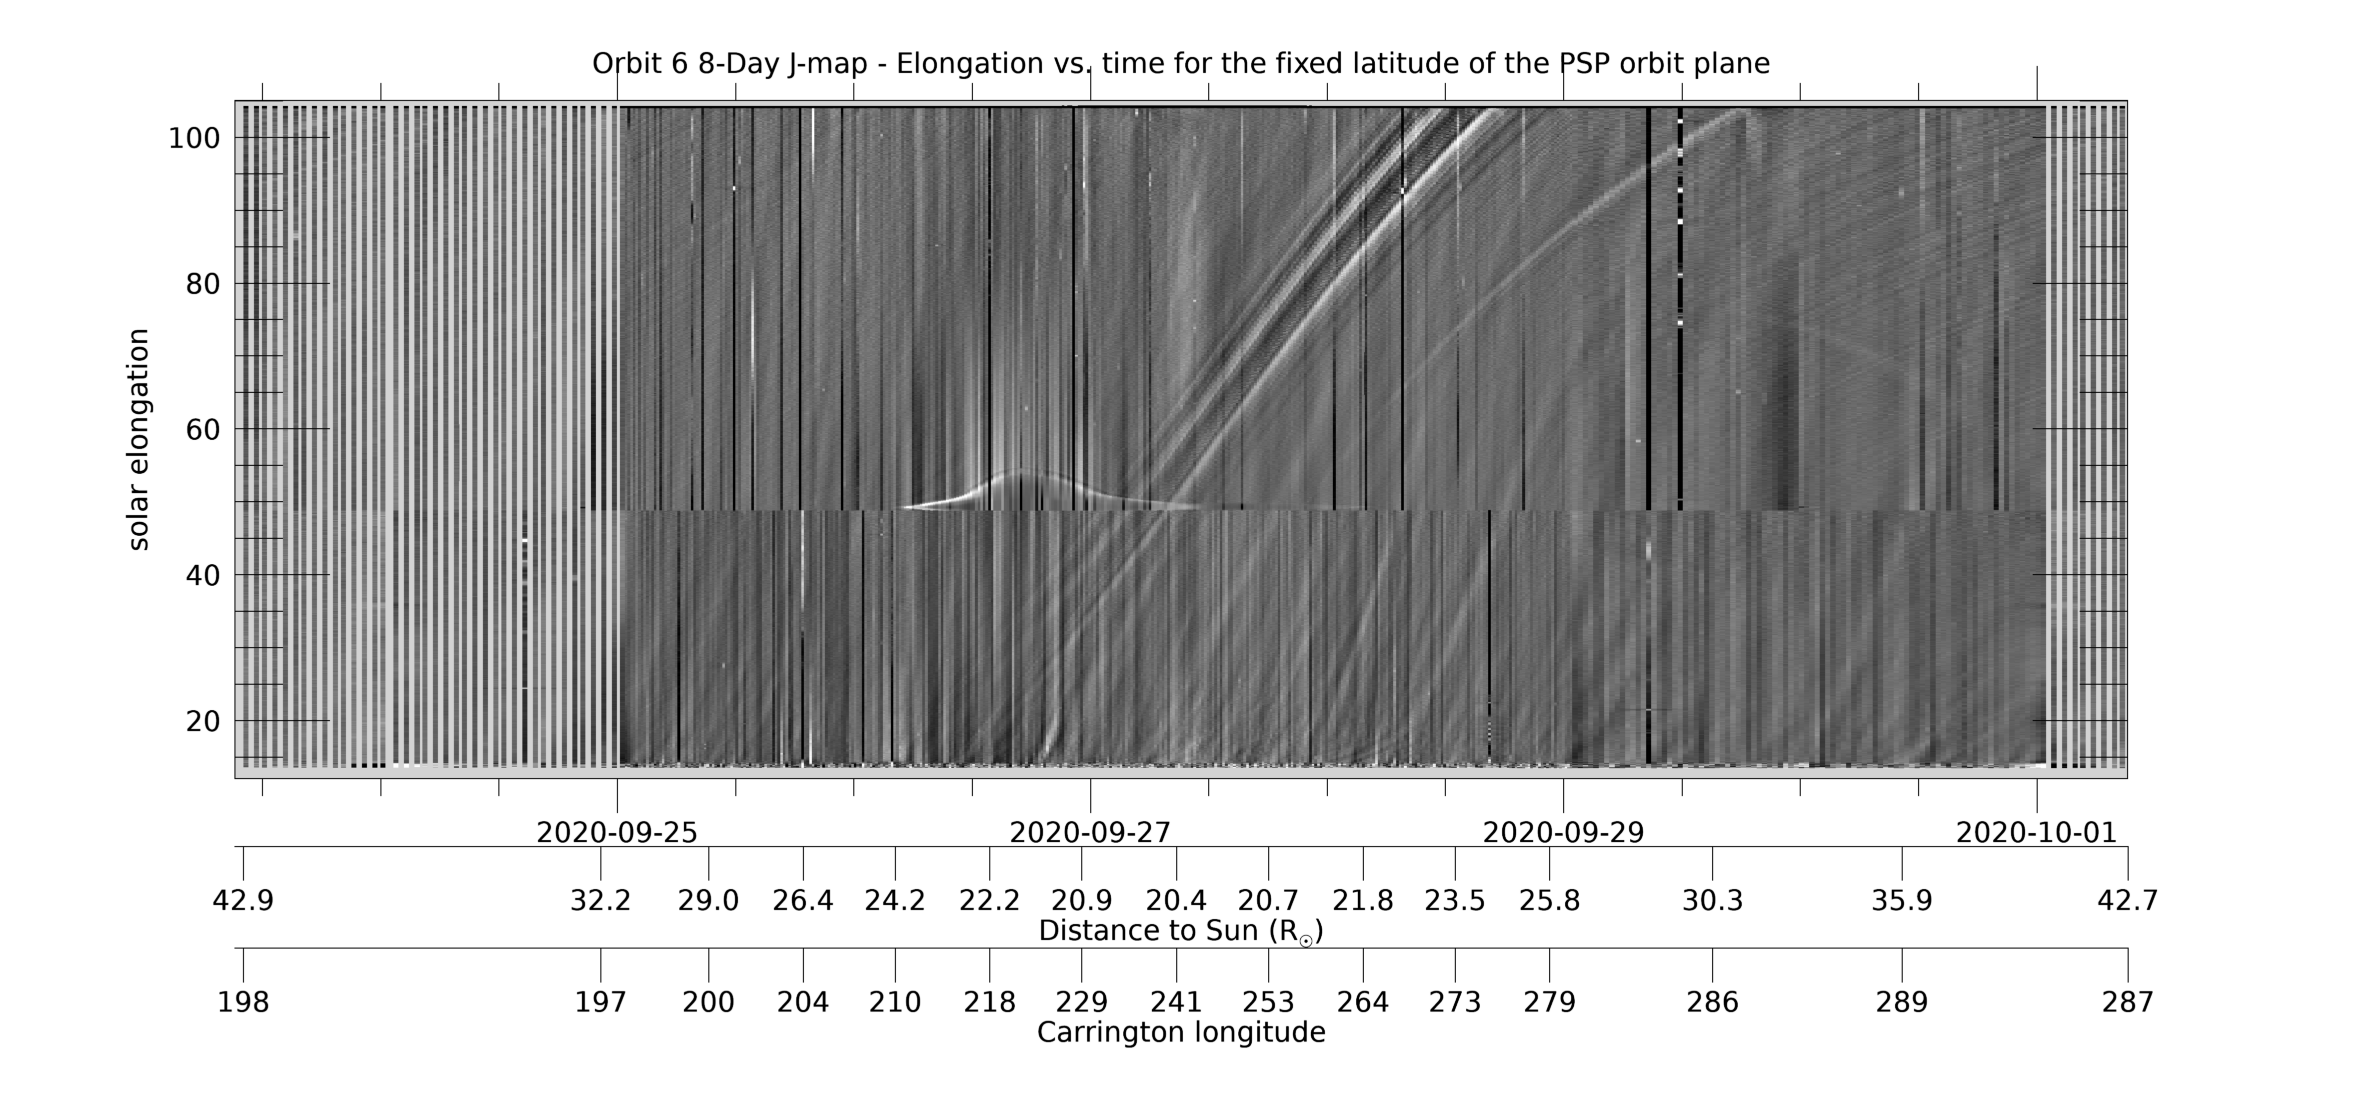
[ABOVE] This 8-day WISPR J-map shows solar elongation (angle from the Sun center) versus time at a fixed latitude measured relative to the PSP-Venus orbit plane. It is created from composite LW-processed full field-of-view (FOV) composite images such as those in the LW movie above, in which the PSP-Venus orbit plane is marked with a blue line. For each image (each time), data is collected along the PSP-Venus orbit plane for the full range of elongations in the WISPR FOV. The collected data is then stacked in time (x-axis) with elongation as the y-axis. The WISPR movies at this web site can be used to identify and find the cause of the various features seen in the J-map. Below the time axis are two additional axes showing PSP’s distance to the Sun RP and its Carrington longitude at that time. The time span in this and subsequent maps is centered on the time of perihelion. [Credit: NASA/JPL. Data processed by Paulo Penteado (JPL/Caltech).]
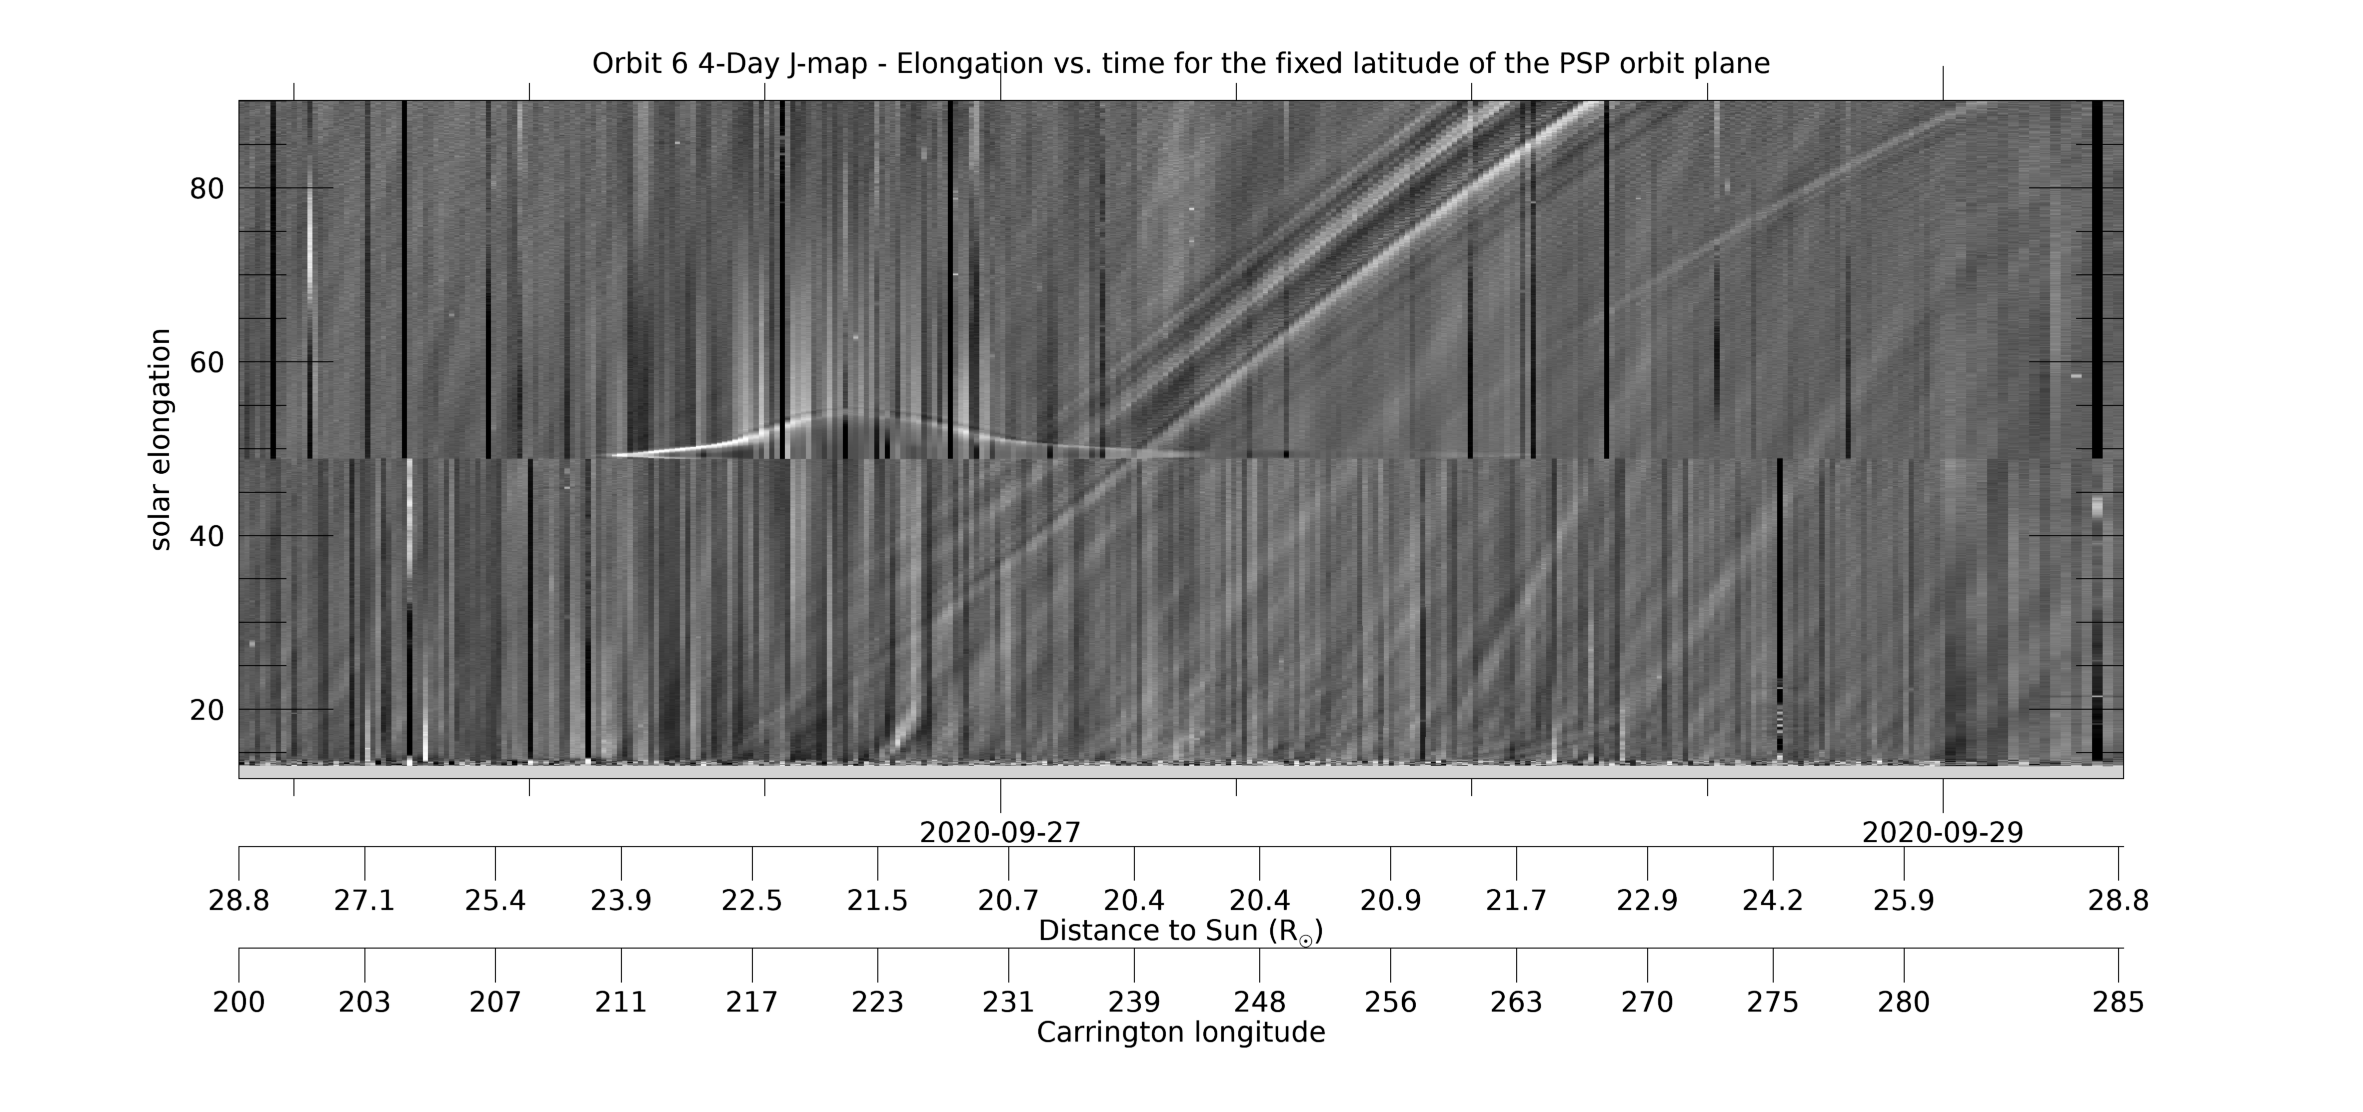
[ABOVE] This 4-day WISPR J-map uses the same data as the 8-day J-map above, but shows only 4 days, centered on perihelion, and only includes distances to 25 R☉ to provide better resolution. See the caption above for more information. [Credit: NASA/JPL. Data processed by Paulo Penteado (JPL/Caltech).]
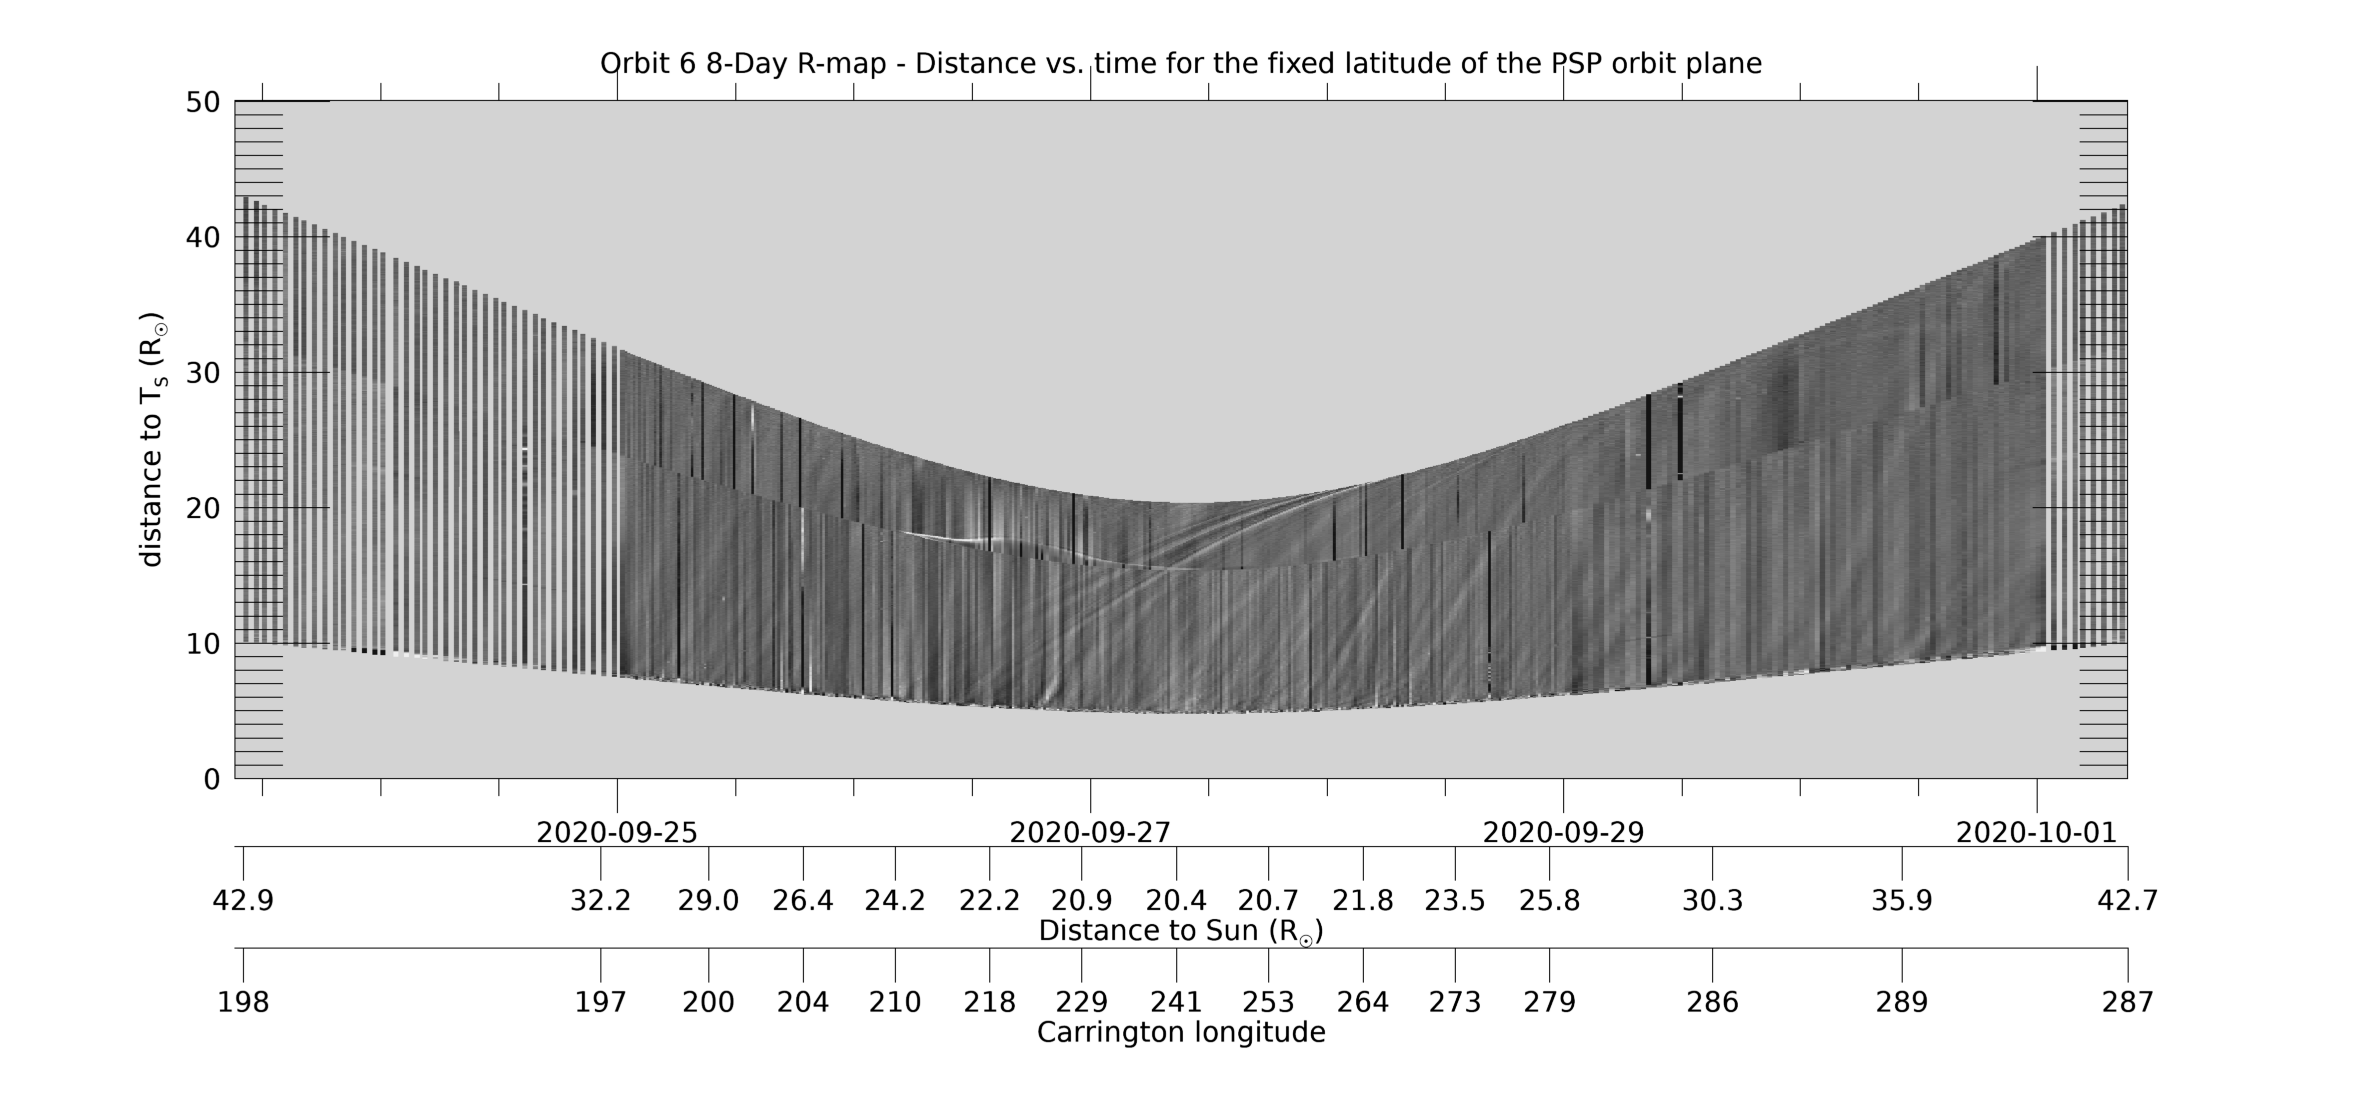
[ABOVE] This 8-day R-map uses the same data as the 8-day J-map (the data collected at each time/image along the PSP-Venus orbit plane), but makes the assumption that the (line-of-sight integrated) signal at each solar elongation all comes from where that line-of-sight hits the Thomson sphere, which is the location of maximum sensitivity of a white light telescope (see, e.g., Vourlidas & Howard, 2006, ApJ,642,1216; DOI: 10.1086/501122). This distance RT (the new y-axis) is related to the elongation by RT=RP*sin(elongation), where RP is PSP’s distance to the Sun. The R-map can be considered a “height-time” plot with and such maps can be used to estimate of the velocity of the observed transients. The LW composite movie above can be used to identify and find the cause of the various features seen in the R-map. Only data up to 90° has been included. [Credit: NASA/JPL. Data processed by Paulo Penteado (JPL/Caltech).]
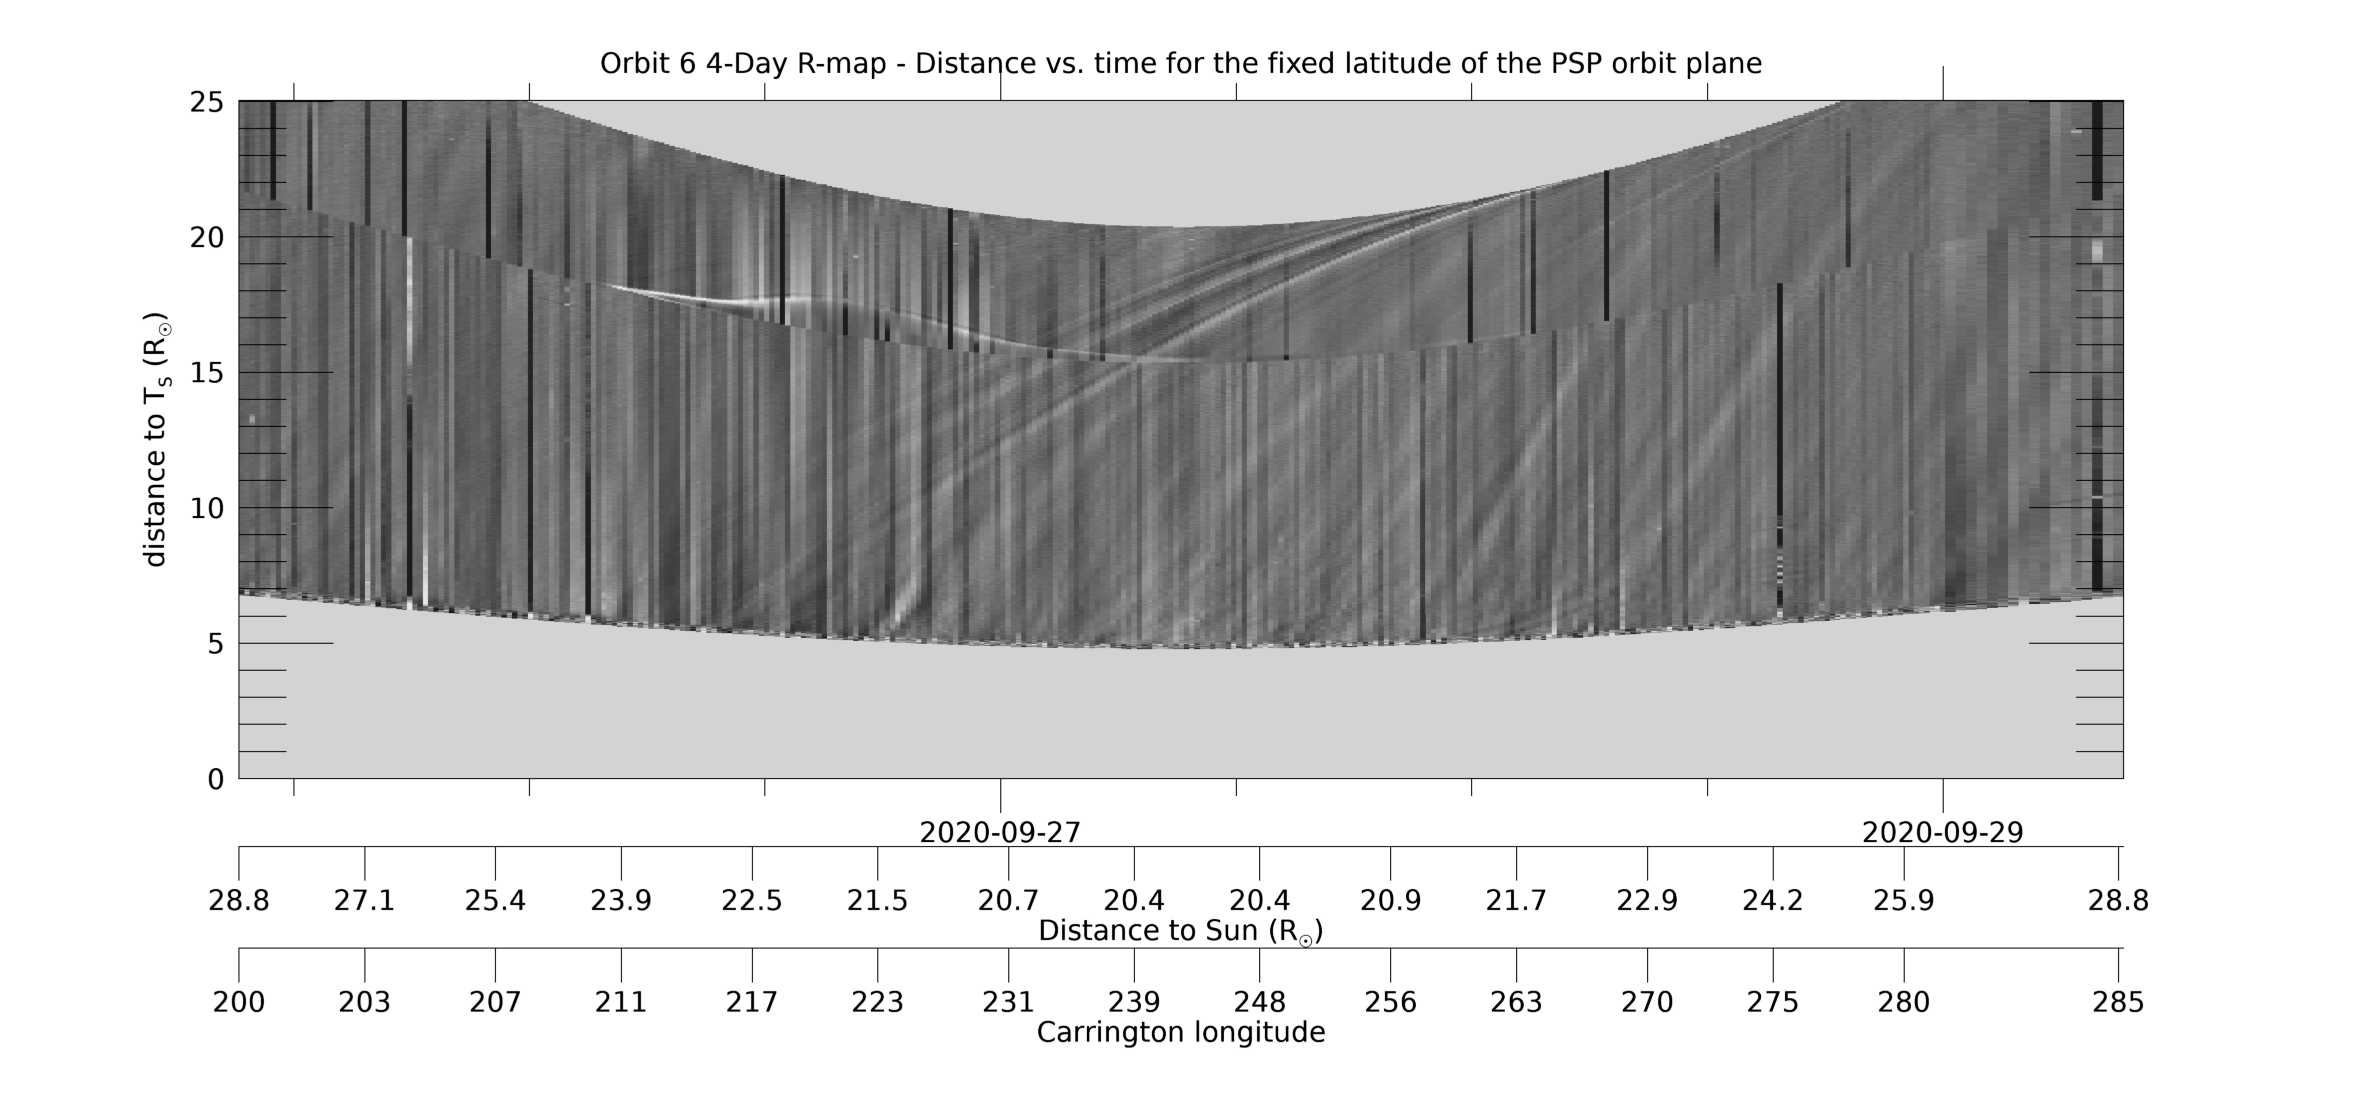
[ABOVE] This 4-day WISPR R-map shows the same data as the 8-day R-map above, but for only 4 days, centered on perihelion, to provide better resolution. See the caption for the 8-day R-map for more information.[Credit: NASA/JPL. Data processed by Paulo Penteado (JPL/Caltech).].
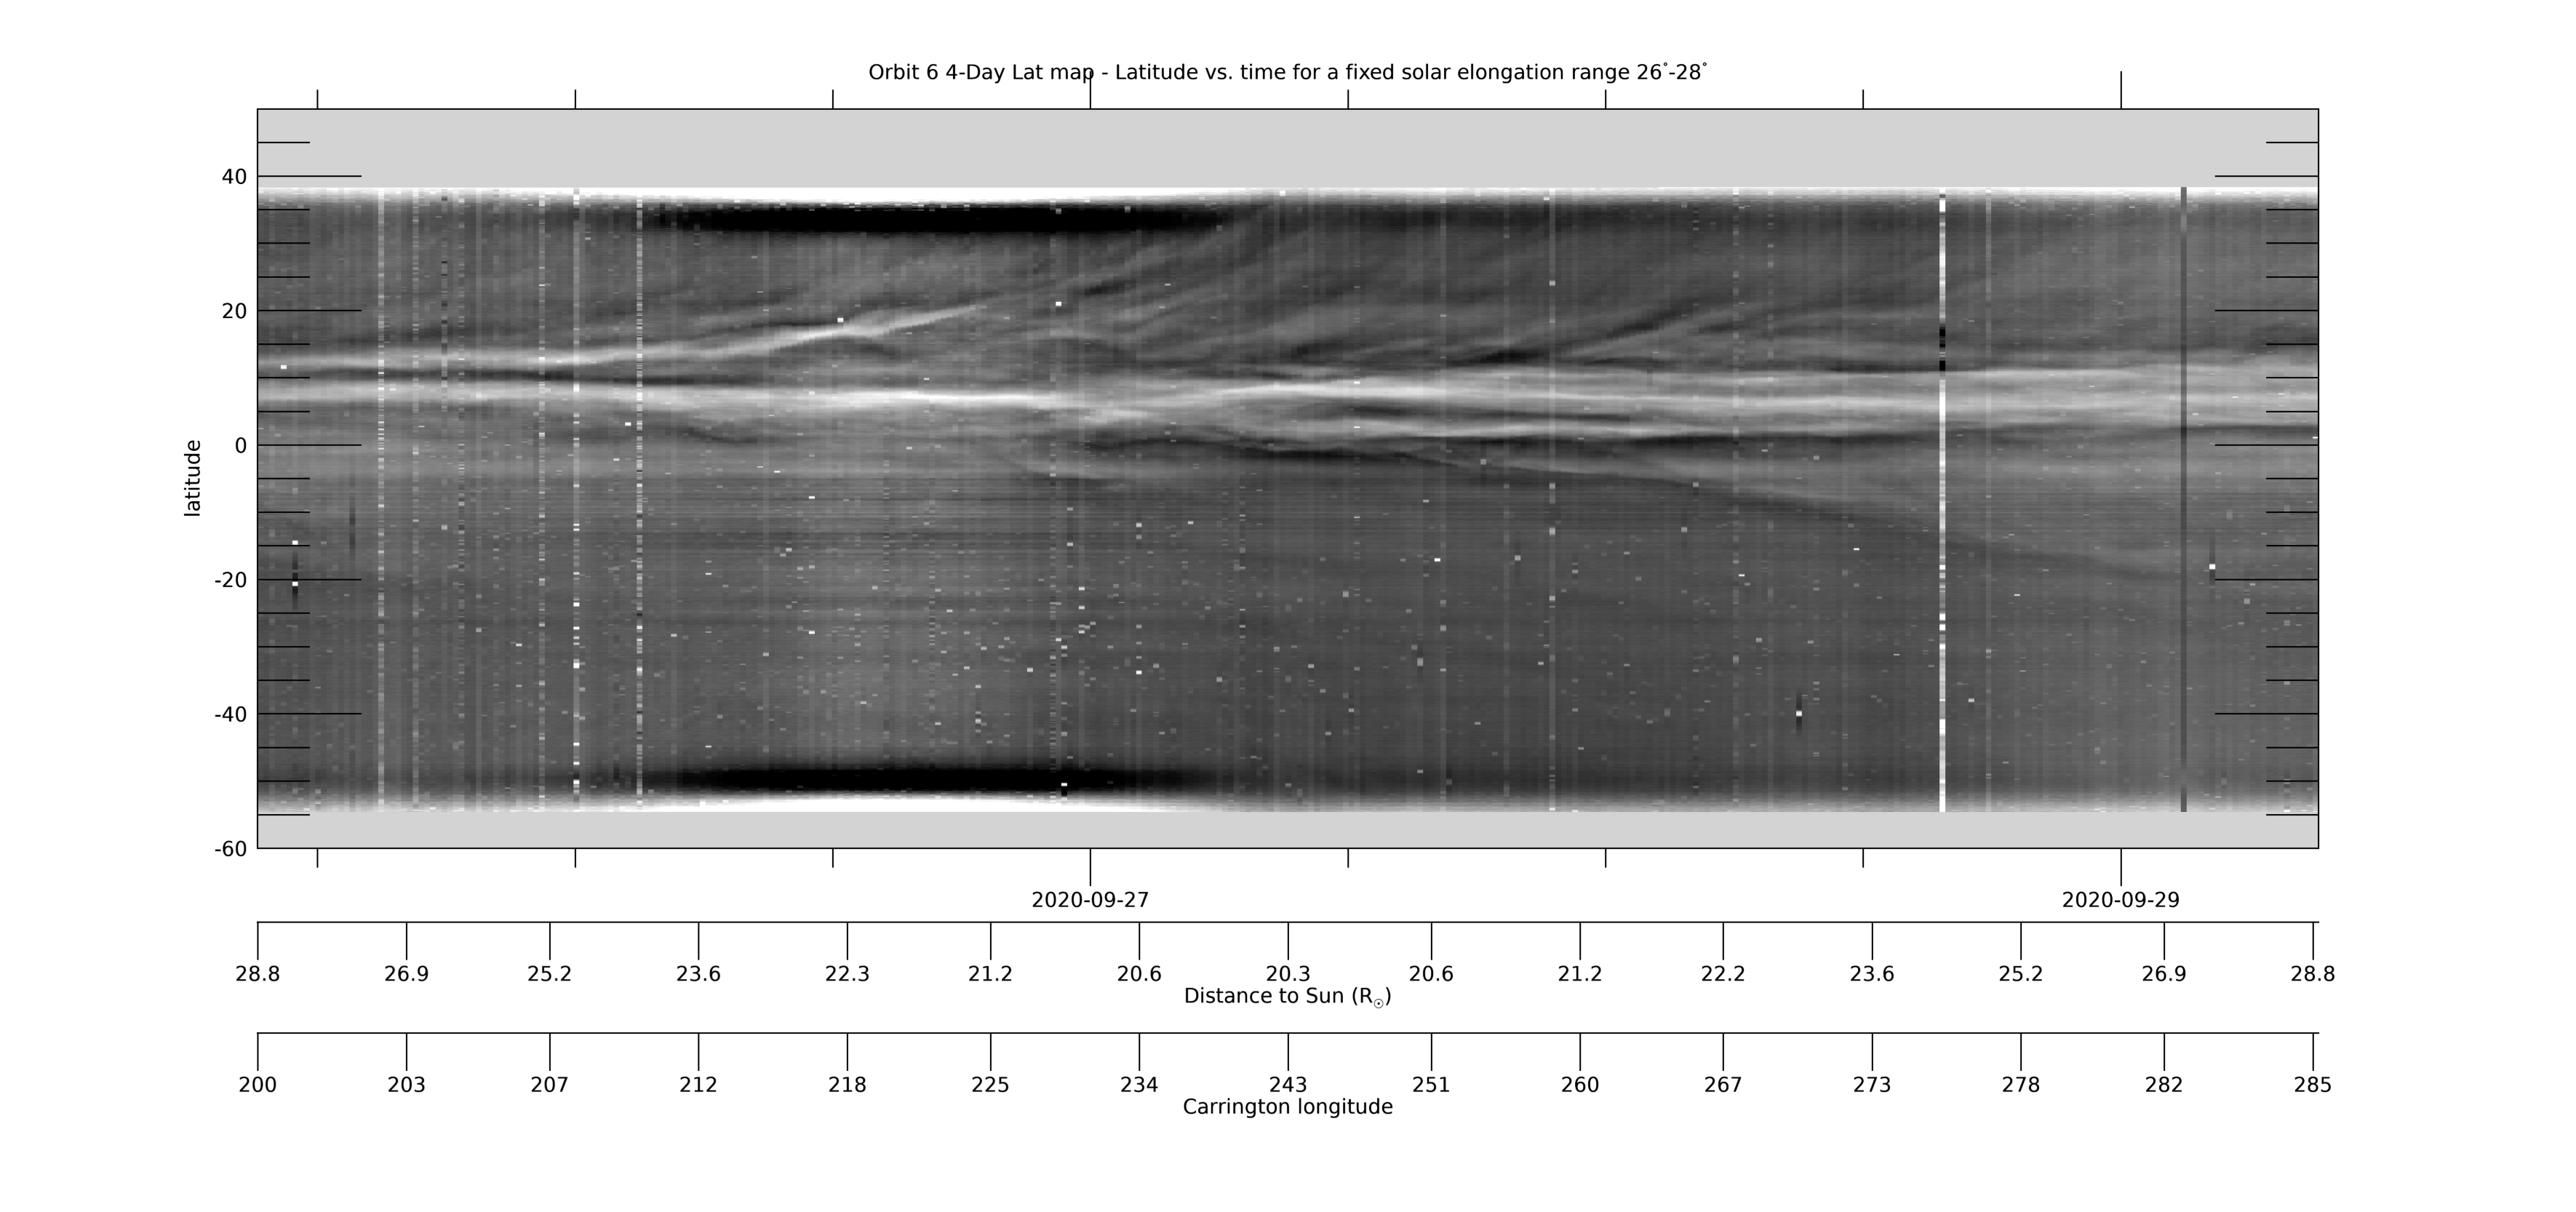
[ABOVE] This 4-day Lat-map shows the evolution in latitude, measured from the PSP-Venus orbit plane, for a fixed solar elongation of 26°-28°. The map is created from L3-processed images by collecting the arc of data in the WISPR-I FOV in the range 26°-28°elongation from each image and stacking the data horizontally in time (for details, see Liewer et al, 2023; DOI: 10.3847/1538-4357/acc8c7). Near perihelion when PSP is moving faster than the Sun rotates, quasi-stationary coronal rays may show large changes in apparent latitude as they approach and pass over or under the spacecraft. The map was created using L3 processed images. The L3 movies at this web site can be used to identify features seen in the Lat-map. [Credit: NASA/JPL. Data processed by Paulo Penteado (JPL/Caltech).]
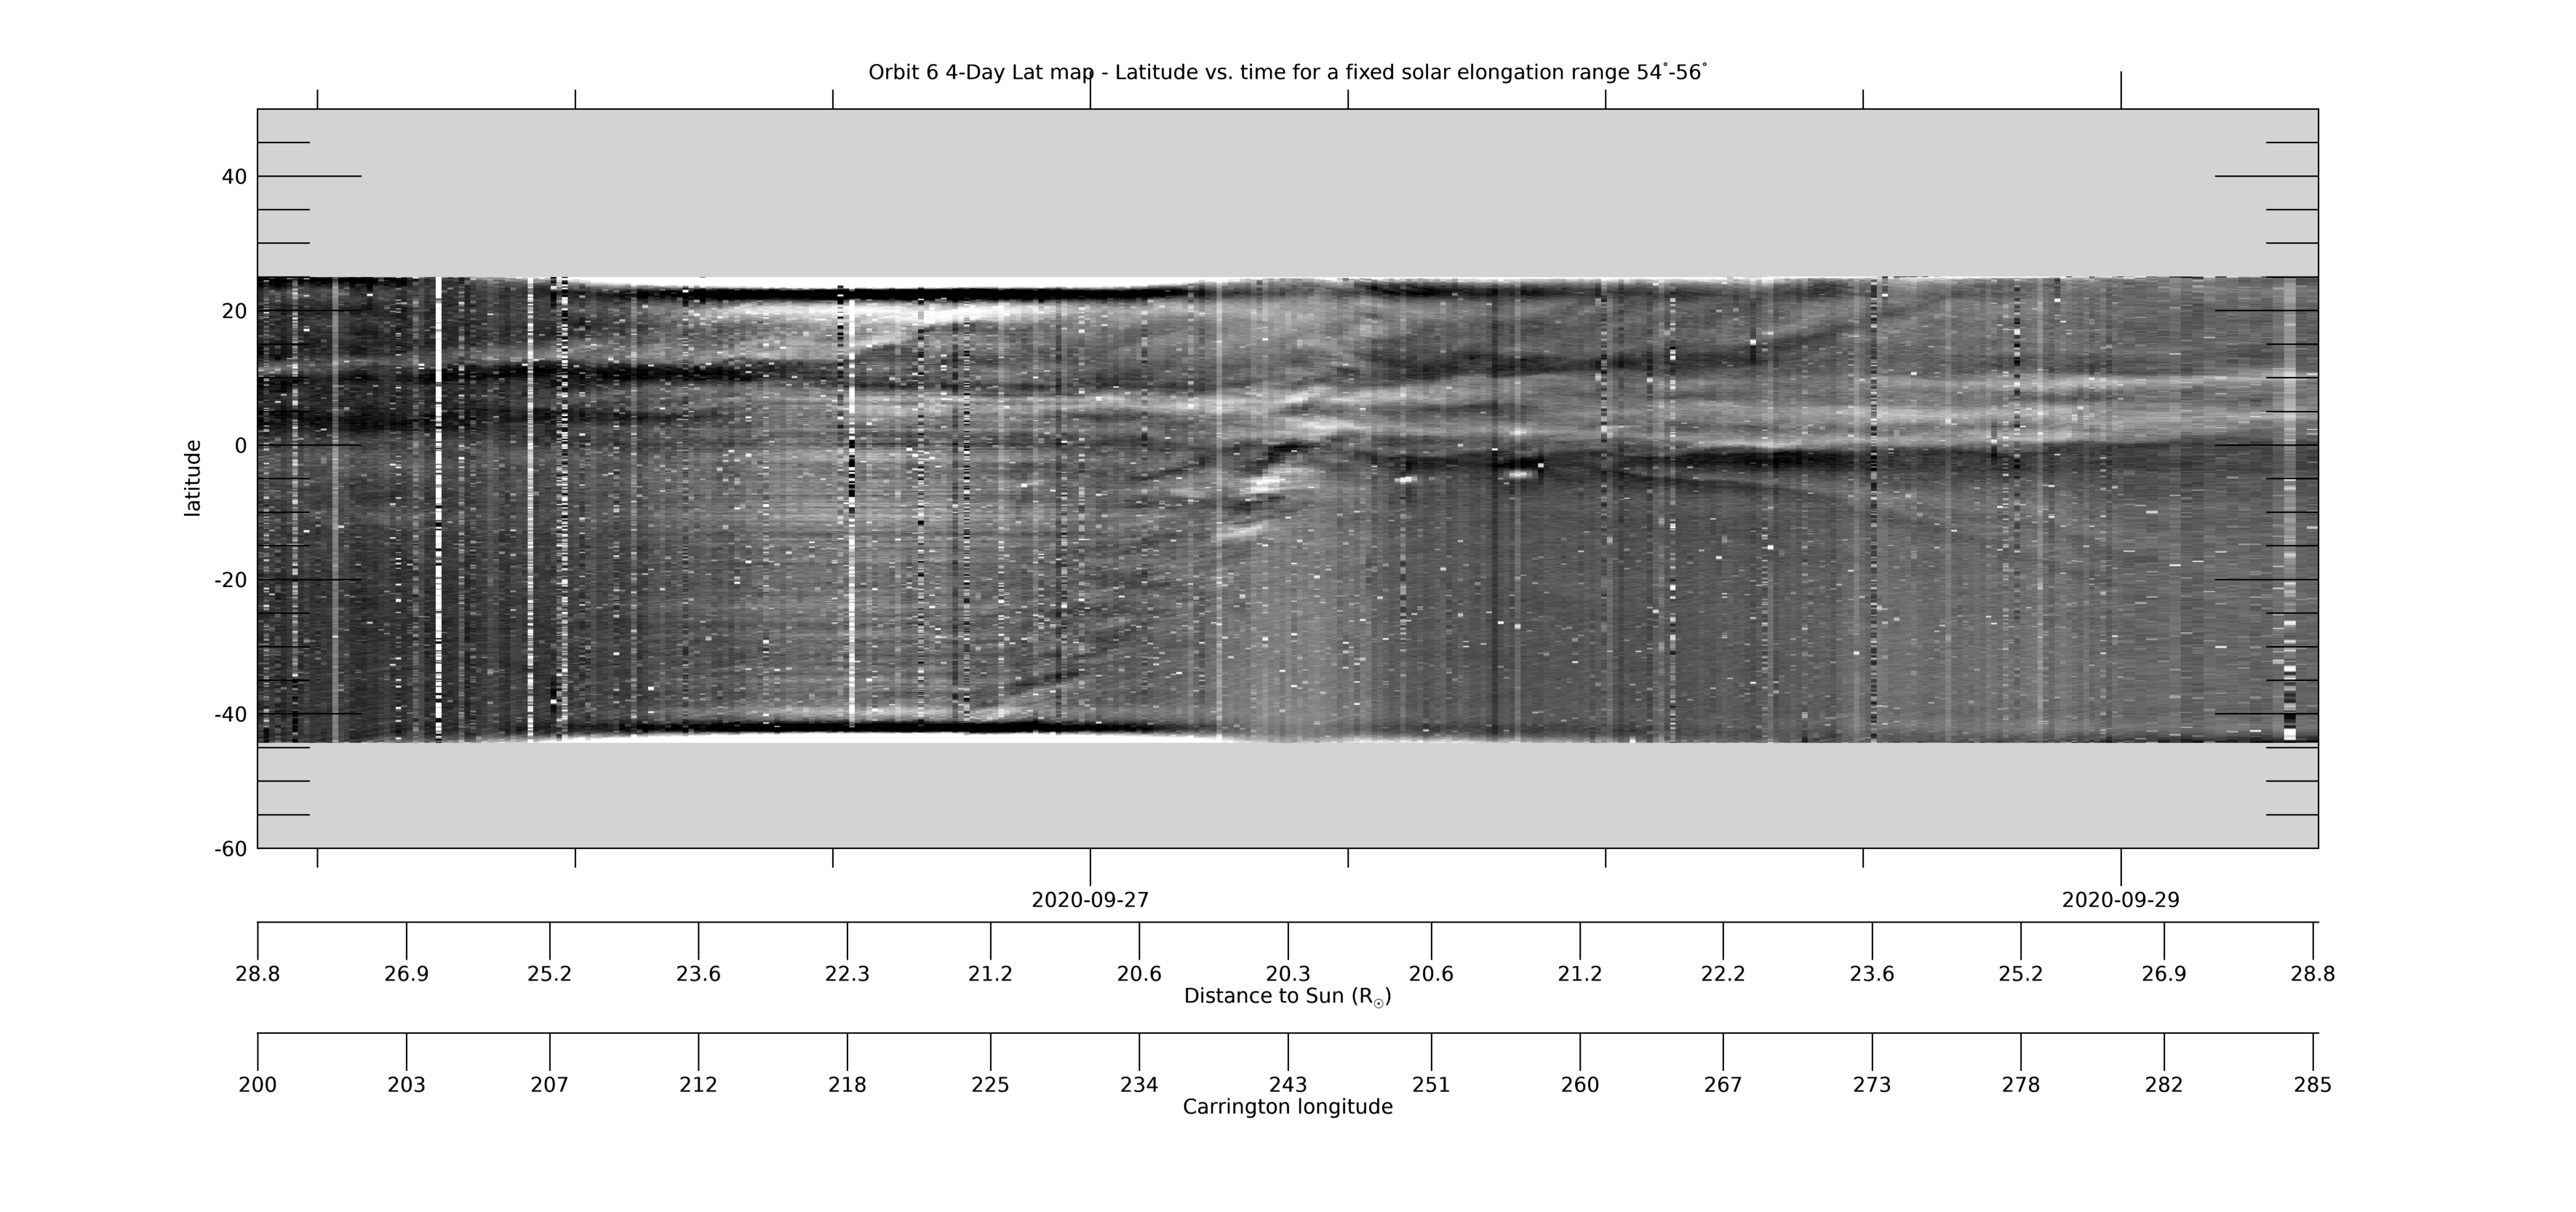
[ABOVE] This 4-day Lat-map shows the evolution in latitude, measured from the PSP-Venus orbit plane, by collecting the arc of data in the WISPR-O FOV for a fixed solar elongation range of 54°-56°. It is made in the same way as the WISPR-I Lat-map above. See that caption for more information. [Credit: NASA/JPL. Data processed by Paulo Penteado (JPL/Caltech).]
Released data for all encounters can be obtained from our WISPR Data Page. Descriptions of other encounters can be found on the Encounter Summaries Page.