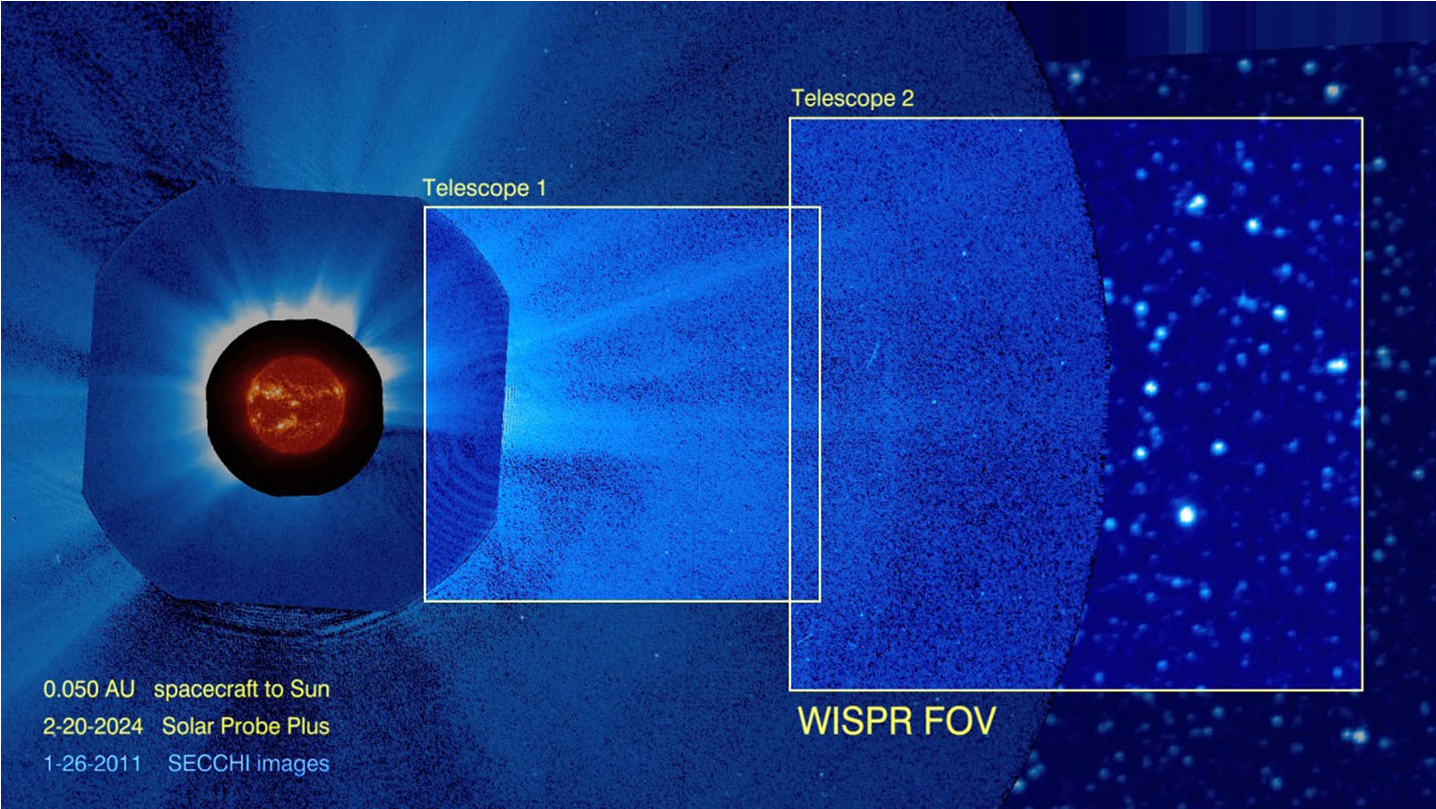
The Parker Solar Probe (PSP) mission is the most ambitious robotic mission to be implemented by NASA. PSP will fly to within 8.86 solar radii (Rs) above the solar surface making it mankind’s first object to enter a star’s atmosphere. This is not the only unique aspect of the PSP mission. It will obtain its first observations from 35 Rs, already uncharted territory, within just three months from launch. The 7-year prime phase of the mission includes not just one but three close perihelion passages at 9.86 Rs from the center of the Sun. The probe will swing from 0.25 AU, the start of the observing period, to perihelion in less than five days, enabling observations from rapidly varying heliocentric distances and viewpoints. Its orbit will, at times, bring PSP to within a few million km from Mercury, Venus, and probably sungrazing comets. The spacecraft carries three instruments for in-situ measurements of particles and fields: the Electromagnetic Fields Investigation (FIELDS; Bale et al. 2014); the SolarWind Electrons, Alphas, and Protons (SWEAP; Kasper et al. 2014); the Integrated Science Investigation of the Sun Energetic Particle Instruments (ISIS-EPI; McComas et al. 2014). The fourth instrument is the Wide-field Imager for parker Solar PRobe (WISPR), a heliospheric imager to provide the large-scale context of the structures encountered by the in-situ instruments, which we proceed to describe next. More details about the mission design, science objectives and implementation can be found in Fox et al. (2014).
Between 18-OCT-2025 and 05-NOV-2025, the WISPR instrument on Parker Solar Probe (PSP) was able to successfully capture a sequence of images of comet 3I/ATLAS. This coincided with a period of time at which the comet was unobservable from Earth due to it being in daylight skies. The WISPR cameras are specifically designed to be able to observe very close to the Sun, and thus were able to successfully detect the comet.
We are releasing the raw science data from this observing sequence, as well as our initial cursory processed version of the images. However, there are some critical factors that any users of this data must consider. Standard operating procedure for WISPR data is to release data three months after downlink from the spacecraft. This allows the instrument team to perform the necessary calibrations to make the data useful for scientific investigation. These images have been prepared for release ahead of the typical schedule, and may still be subject to slight changes in the calibration upon further examination. Therefore, use of this data for science investigations, in its current form, is strongly discouraged. We urge anyone seeking to analyze this data to reach out to a member of the WISPR team for guidance.
The data can be obtained in one the following zip files:
As a complete ~99MB zip file, containing both L1 and L2 FITS data, available at this link [right-click and save-as]
As a complete ~34MB zip file, containing only L1 FITS data, available at this link [right-click and save-as]
As a complete ~66MB zip file, containing only L2 FITS data, available at this link [right-click and save-as]
About the Observing Plan
The scheduling of observations for WISPR is such that observing plans must be prepared and uploaded to the spacecraft well in advance of the observations being obtained. An observing plan fundamentally consists of a list of dates, times, exposure times, and (when needed) field of view limits for each planned observation, as well as, in this instance, a spacecraft roll to be able to capture 3I/ATLAS in the field of view. The 3I/ATLAS image sequence was planned to occur as PSP was moving away from the Sun following its most recent encounter, but prior to downlinking the data recorded during that encounter. Thus, there were strict limits on the amount of available storage space left for recording 3I/ATLAS images.
An observing plan was formulated that would extract sub-regions of the full-field of view (to reduce the size of the data obtained and increase the total number of images), and would track the comet as it crossed the field of view of the WISPR Inner detector. While the comet would technically have also crossed the field of view of the WISPR Outer detector, no images from that camera were recorded during this period, because of operational and telemetry limitations. The observing plan was separated into daily sequences of approximately 10 images per day within a fixed subfield each day. The subfield would move on each subsequent day to account for the motion of the comet and spacecraft, and attempt to keep the comet approximately centered in the field of view.
At time of preparation, the predicted brightness of 3I/ATLAS was much fainter than it ultimately ended up as. Therefore, the observing plan sought to use the maximum exposure time possible for each subfield while attempting to minimize the saturation of the sunward side of the images. Typically, exposure times are optimized by using the longest exposure time possible that will not saturate the inner edge of the detector. Because this sequence was at larger distances from the Sun than typical WISPR observations, and because the exact location of the subfield window was changing, these exposure times were estimates of the longest allowable time to make the comet detectable, without saturating the background. Specific exposure times are recorded in the FITS headers of the provided data, following the standard FITS header keyword convention.
The observations approximately span the period surrounding the comet's perihelion (1.36au on October 29, 2025). The spacecraft was moving away from the comet during this period, starting at approximately 1.85au from it, and moving to ~2.1au by the end of the sequence.
As can be seen in the data we provide below, the images obtained on the last few days of the sequence were still somewhat saturated. Regardless, the net result is that the apparent brightness of the comet changes in each day of observations simply due to the decreasing exposure times used on each day. Therefore, any attempt to perform scientific analyses of the Level-1 images should, at an absolute minimum, normalize the data by exposure time (this, along with many other calibration steps, has already been applied to Level-2 images).
Processed Images
As widely described in peer-reviewed publications, WISPR data requires complex processing algorithms in order to remove the excess stray light from the solar "F-corona". In particular, a large span of data (several days) is required to develop accurate models that remove this excess stray light and enable clearer observation of features of interest. Give the newness of this data, and the relative small set of observations recorded during this time period, this additional processing step has not yet been performed.
However, to provide a qualitative 'quicklook' at the WISPR Observations of 3I/ATLAS we have prepared two short image sequences based upon the FITS data made available above, and using image/data processing algorithms employed locally by the WISPR science team. These images are not intended for any kind of scientific study or scrutiny, and were processed simply to enable scientists to quickly validate that the comet was detected in the observations.
Important note: By default, WISPR images are rectified relative to the top side of the spacecraft (spacecraft North). For this set of images, the spacecraft was rolled ~180 degrees to capture the comet. Thus for each movie, the Sun is toward the left of the image, and Solar North is toward the bottom of the image.
This animation shows the raw, unprocessed observations recorded by PSP/WISPR for observing interstellar comet 3I/ATLAS. You can download this movie directly as a 441kB mp4 file.
[Credit: NRL/NASA/JHUAPL. Movie processed/compiled by Phillip Hess (NRL).]
The above image sequence shows byte-scaled Level-2 images from the 3I/ATLAS observing plan. Comet 3I/ATLAS can be seen crossing the field, right to left, a little above center. The only correction made in these files is a scaling factor to try to minimize the overwhelming brightness of the solar F-corona. As described above, the comet appears to 'jump' between frames because a slightly different sub-field image was recorded each day in order to simplify the observing sequence, and optimize telemetry (storage) use.
This animation shows the WISPR observations of 3I/ATLAS in images projected to the celestial sphere, and processed to remove the bright solar corona. You can download this movie directly as a 1.2Mb mp4 file.
[Credit: NRL/NASA/JHUAPL. Movie processed/compiled by Guillermo Stenborg (JHUAPL).]
The above image sequence is also based upon the L2 FITS images from the 3I/ATLAS observing plan. Processing was applied to minimize the effect of the star field and bright solar f-corona, and project the images into an inertial reference system to showcase the comet’s evolution, which in the image frame of the FITS files is difficult to grasp because of the changing pointing of the spacecraft and data gaps during the observing time window.
Work is ongoing to process and analyze this data, and updates will be provided here when available. Again, given the complexity of the WISPR calibration process, we urge anyone wishing to perform scientific studies with these data to contact a member of the WISPR Team for assistance.
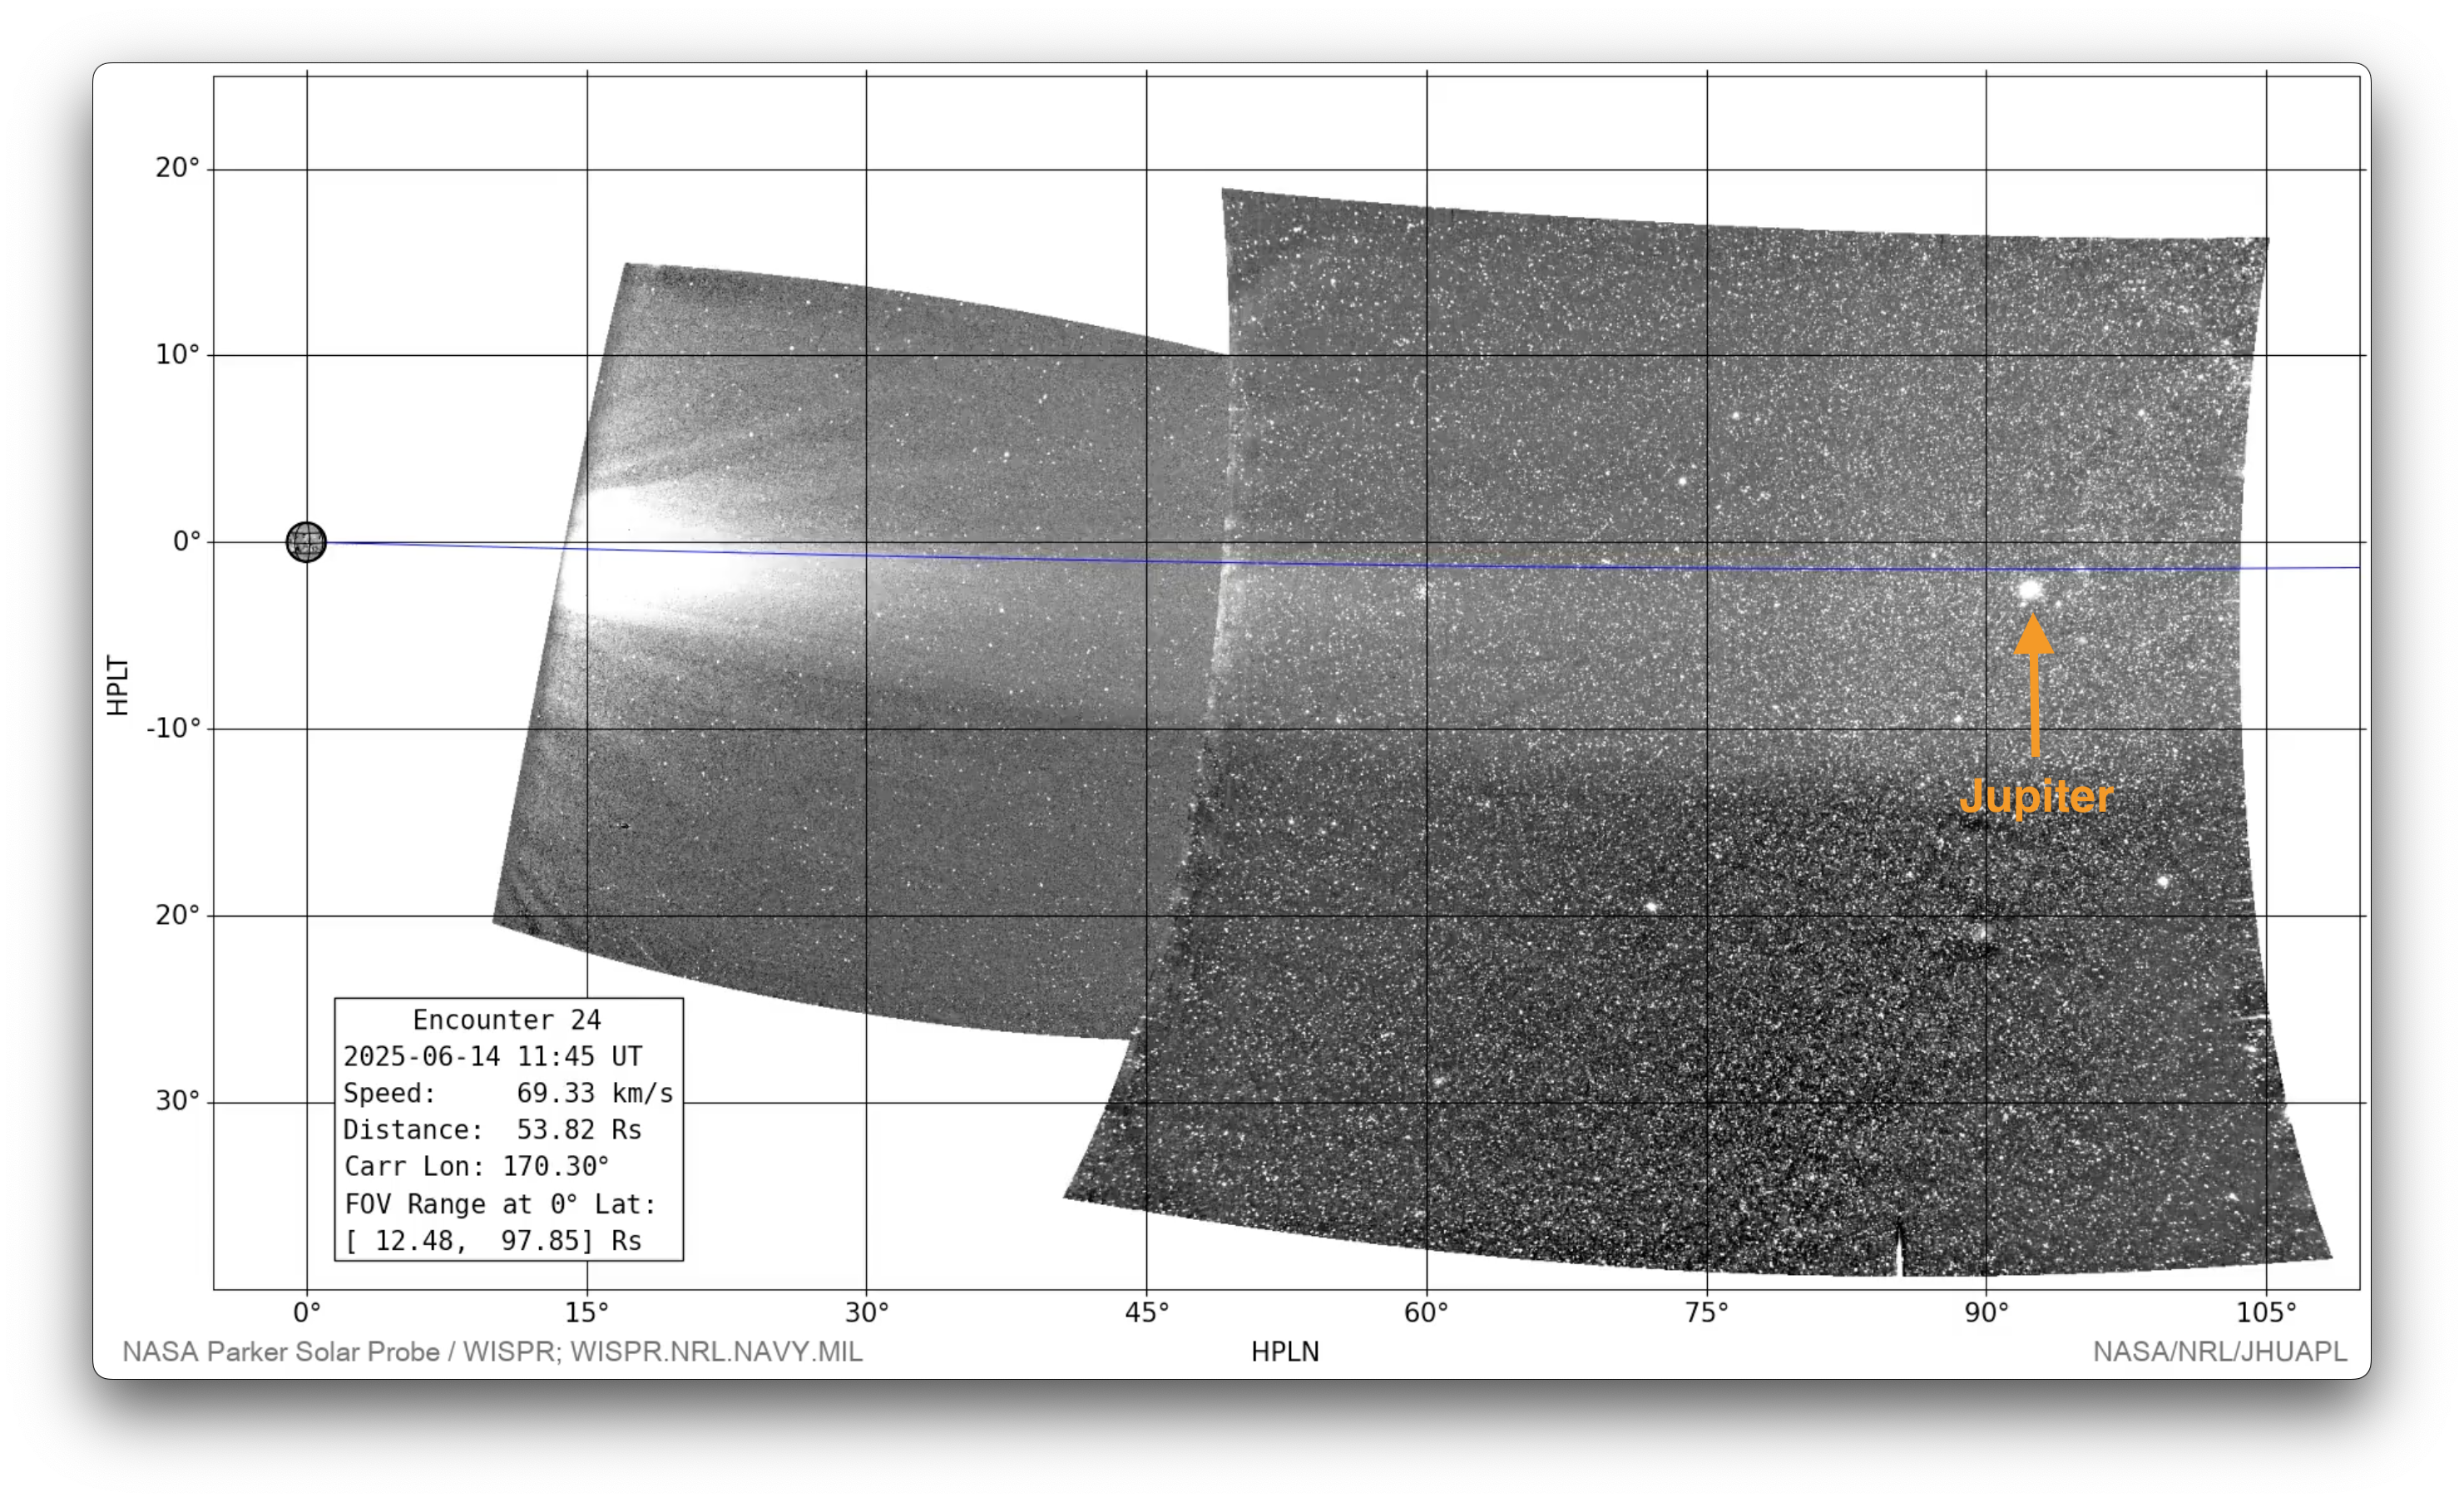
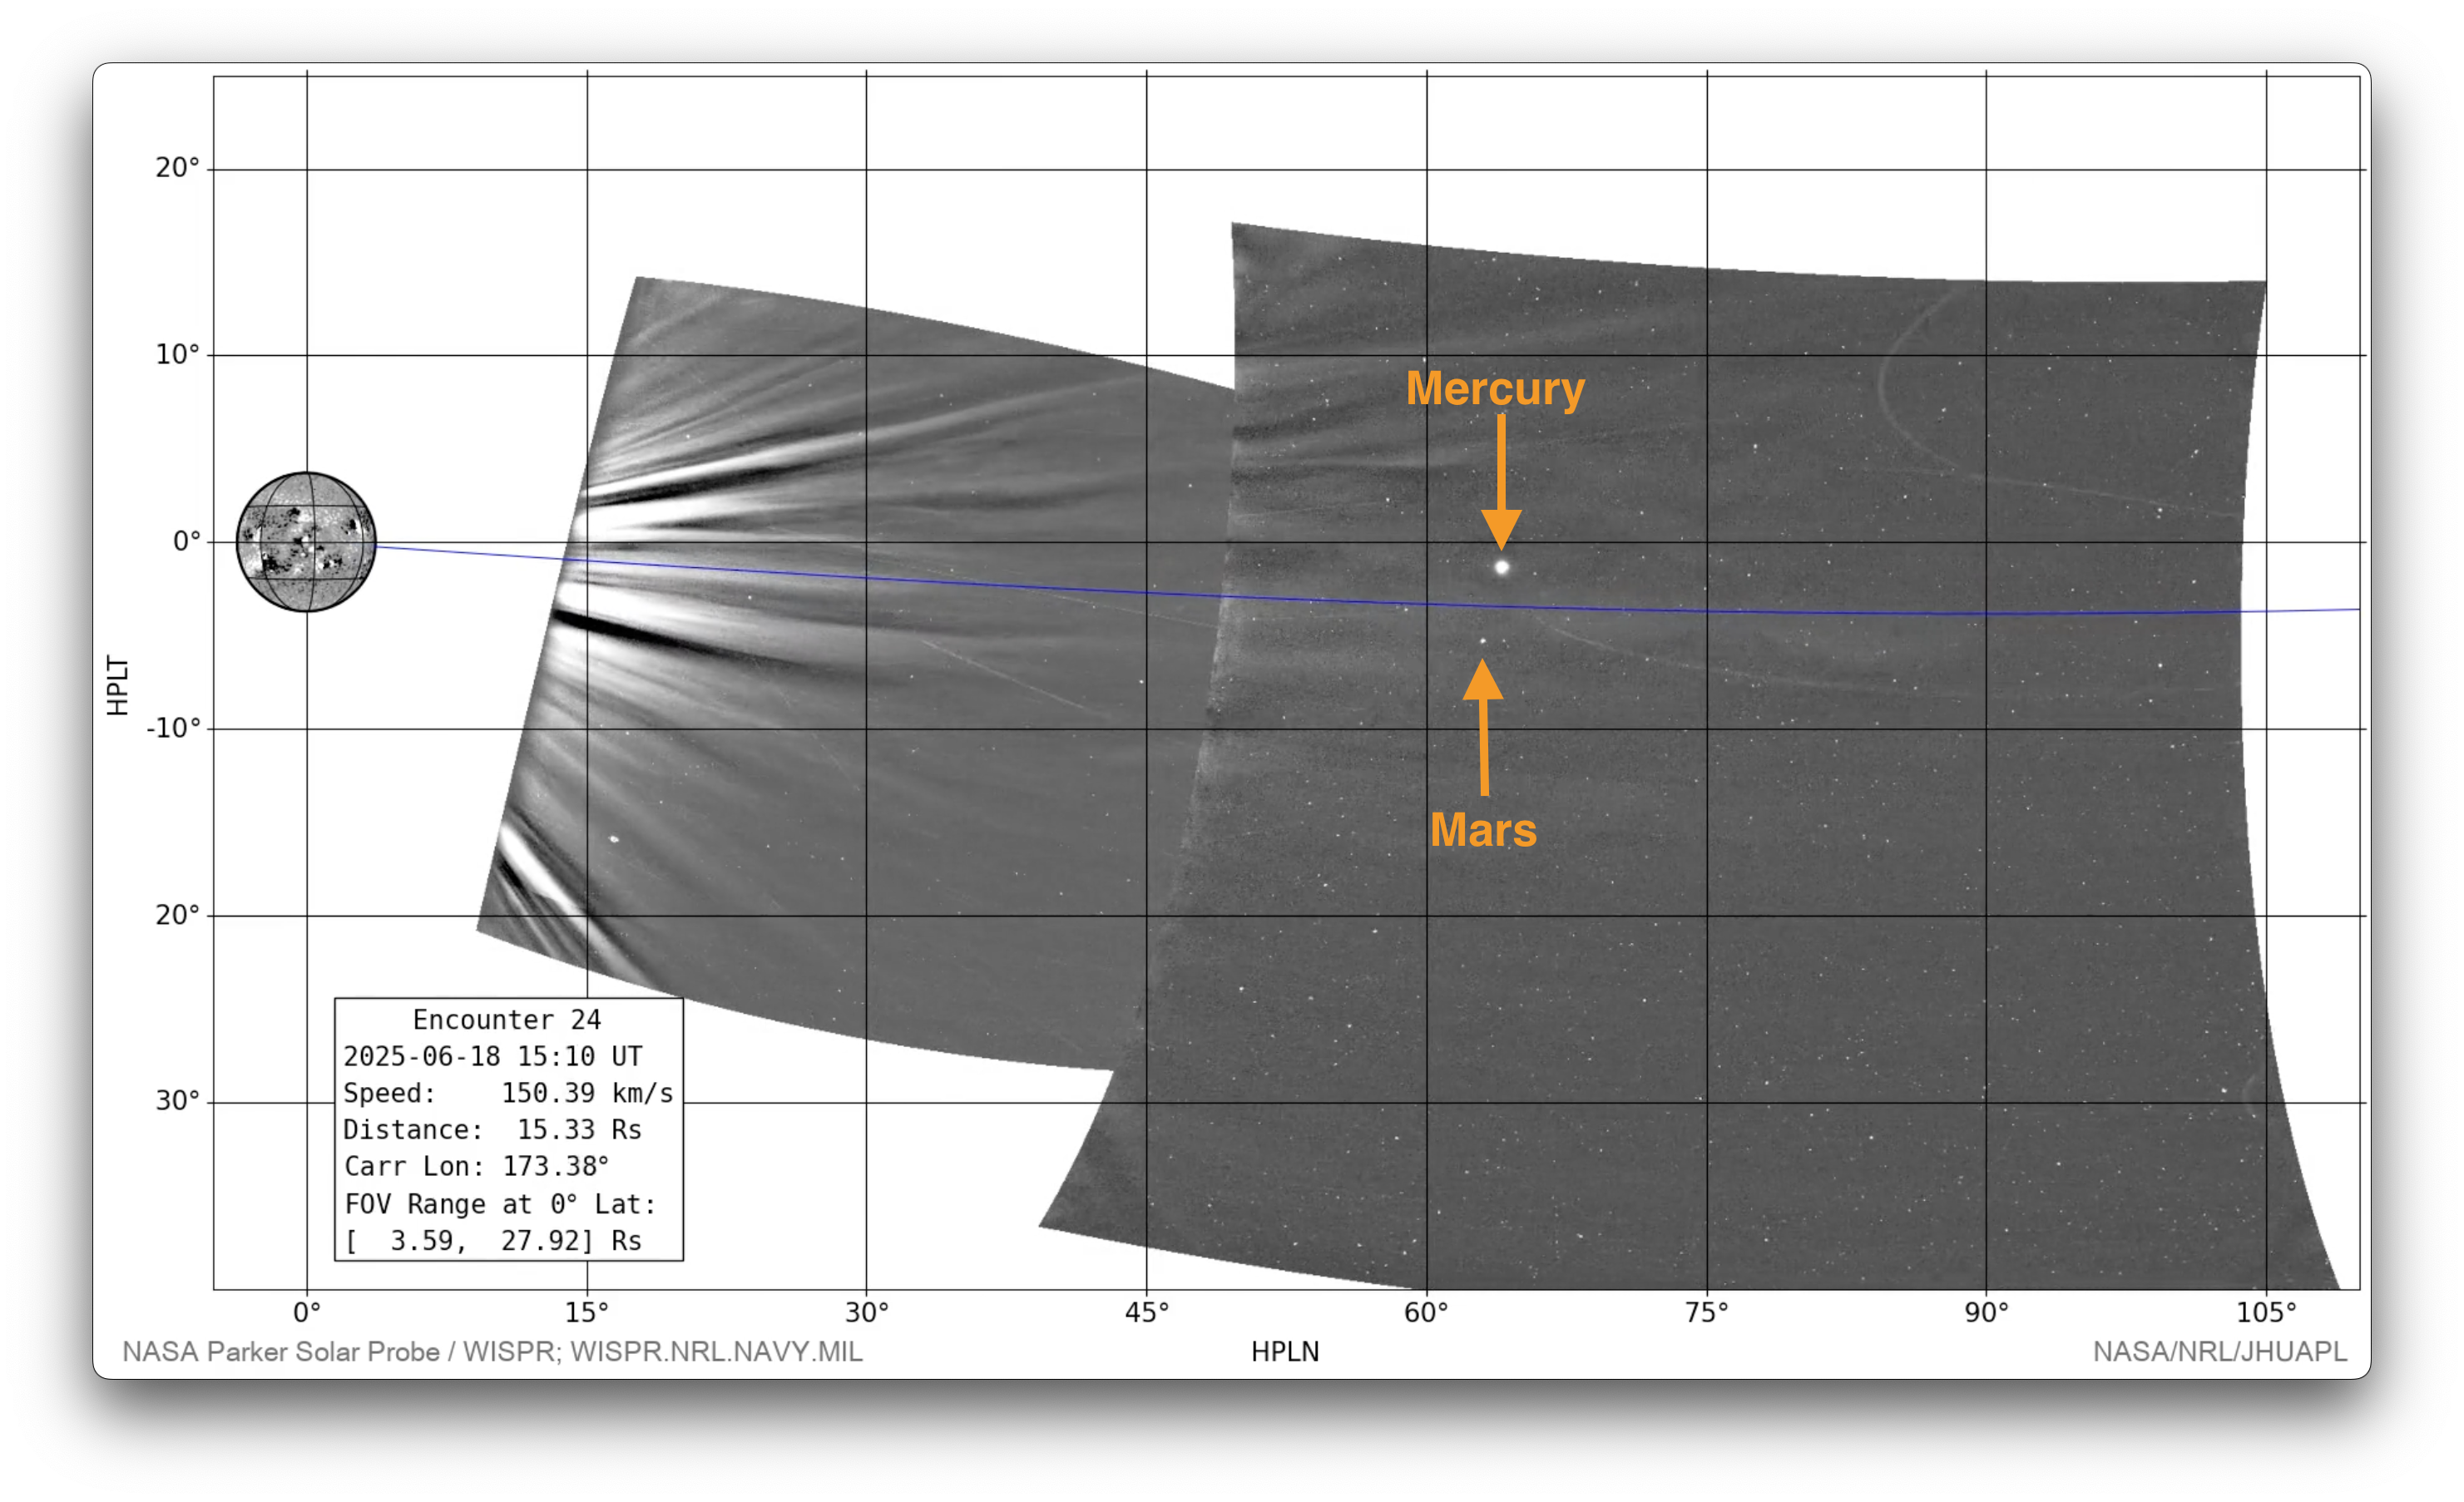
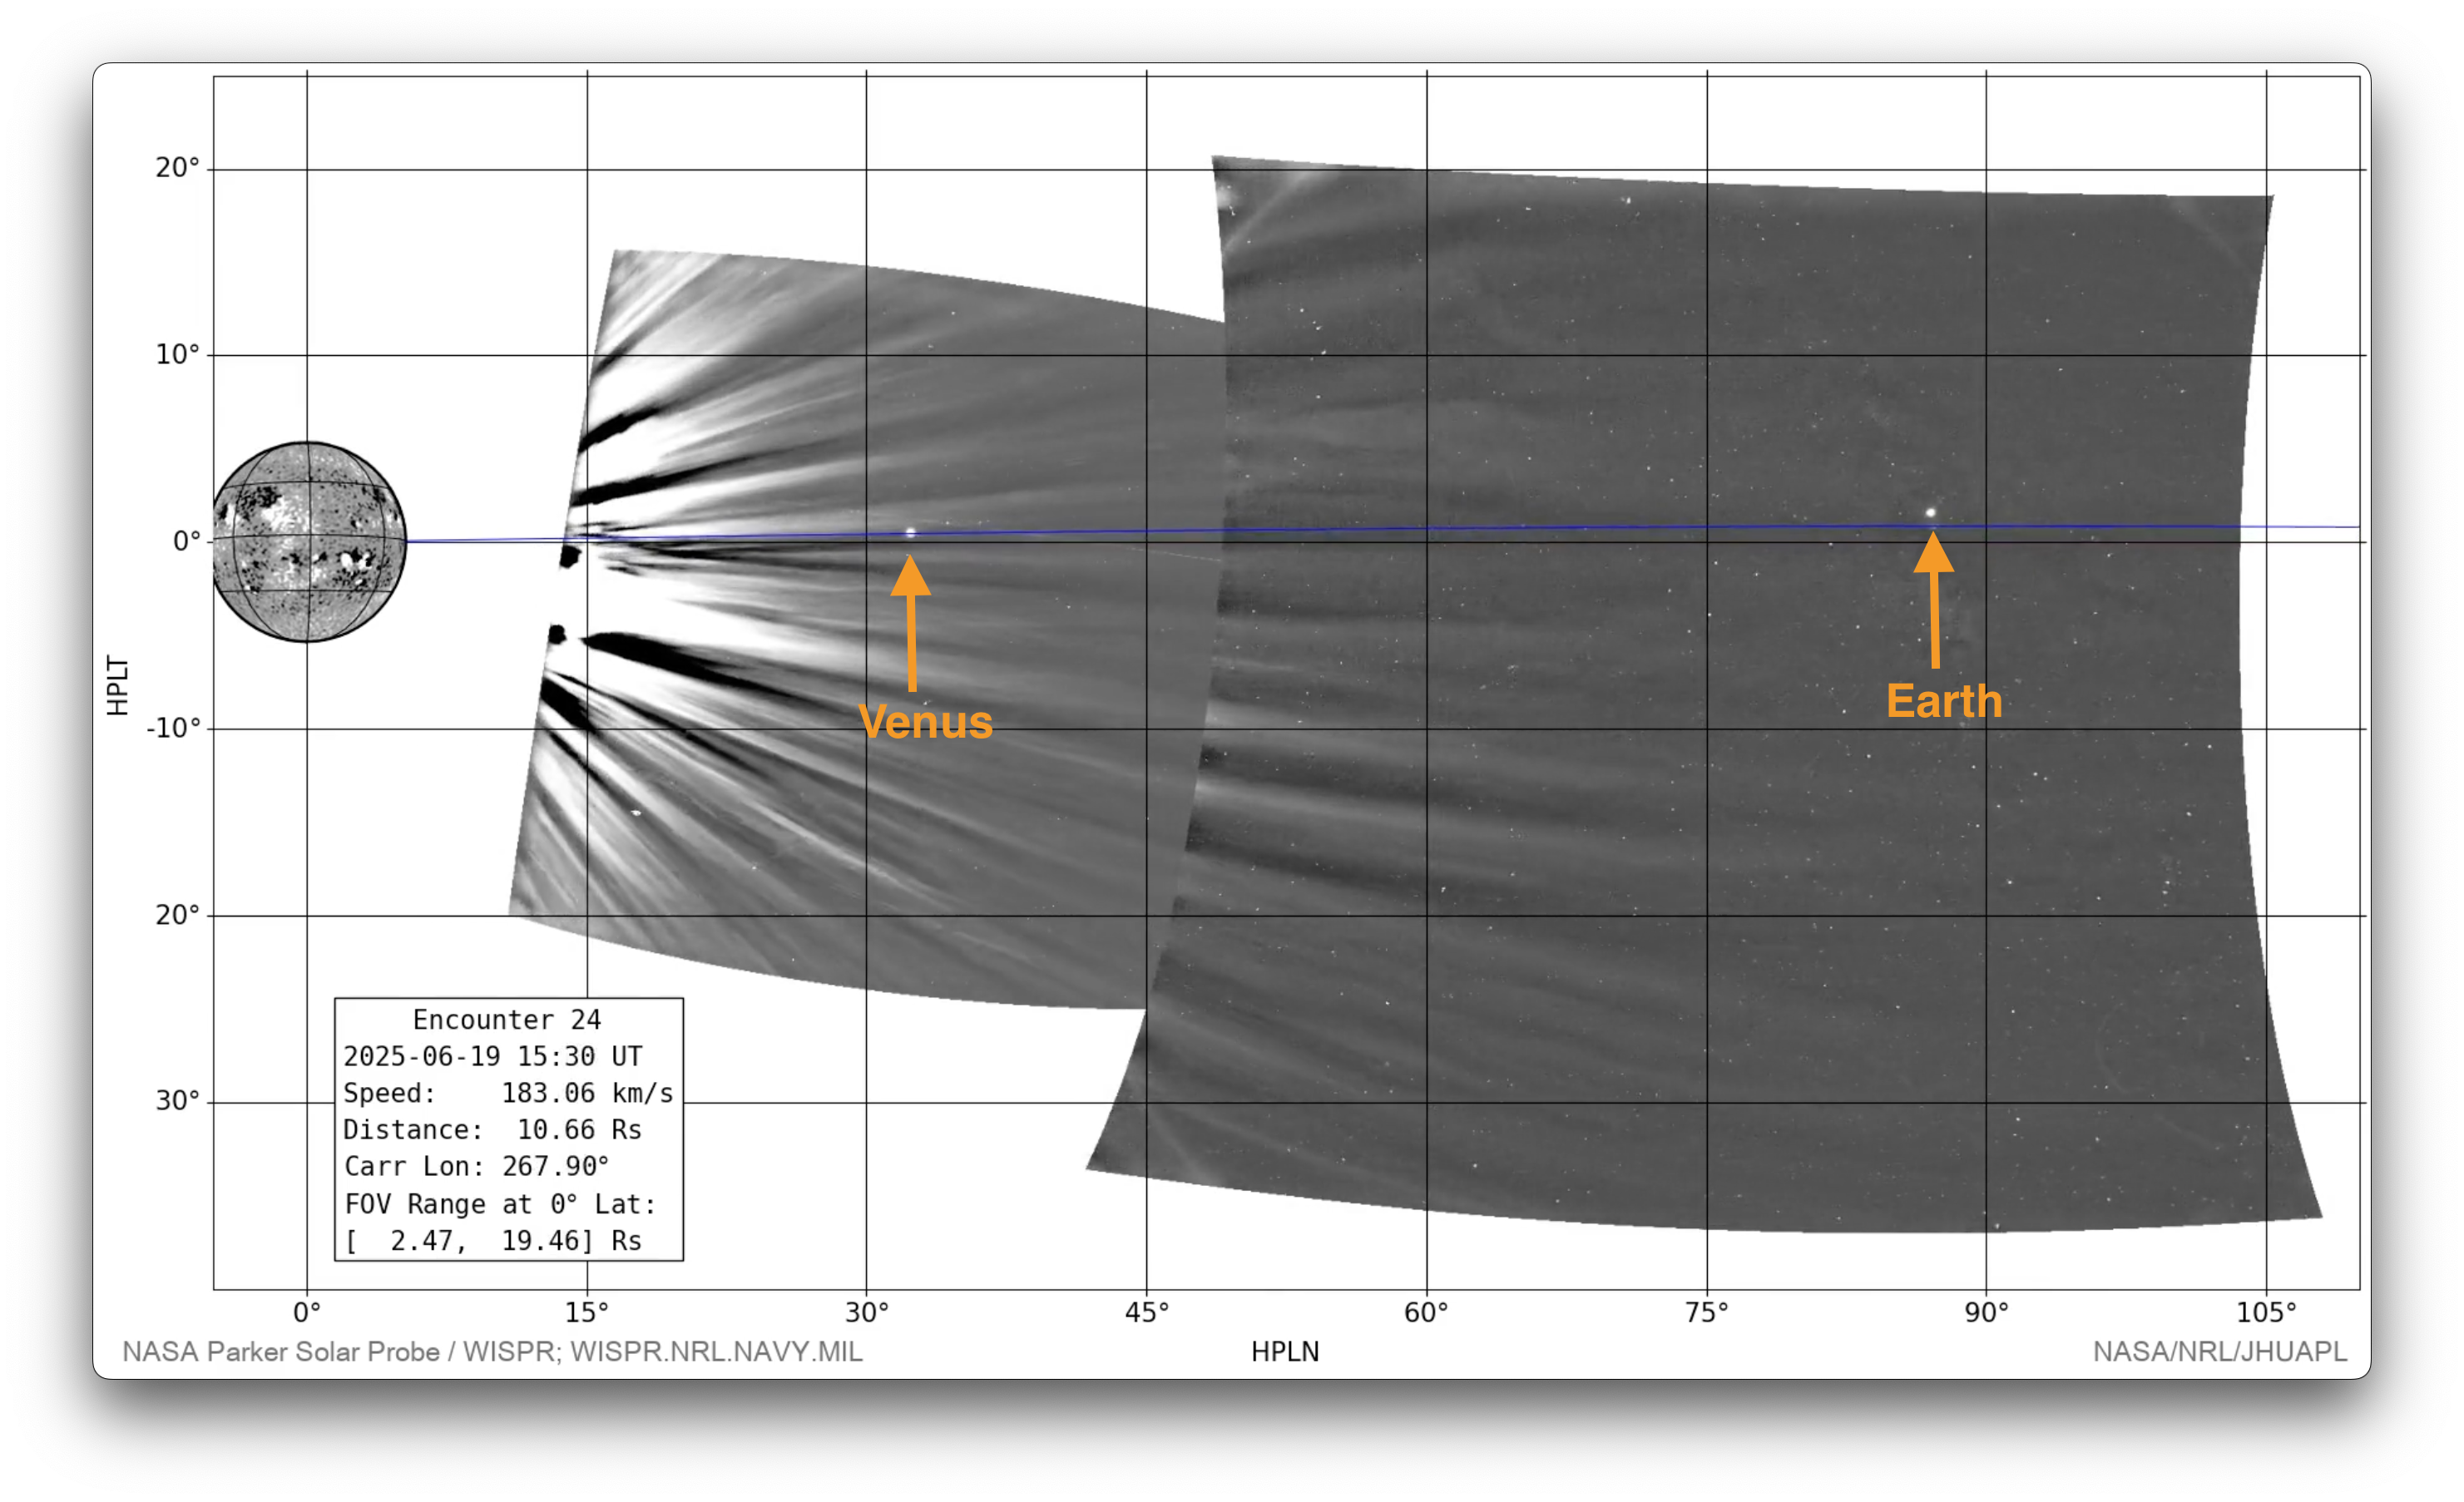
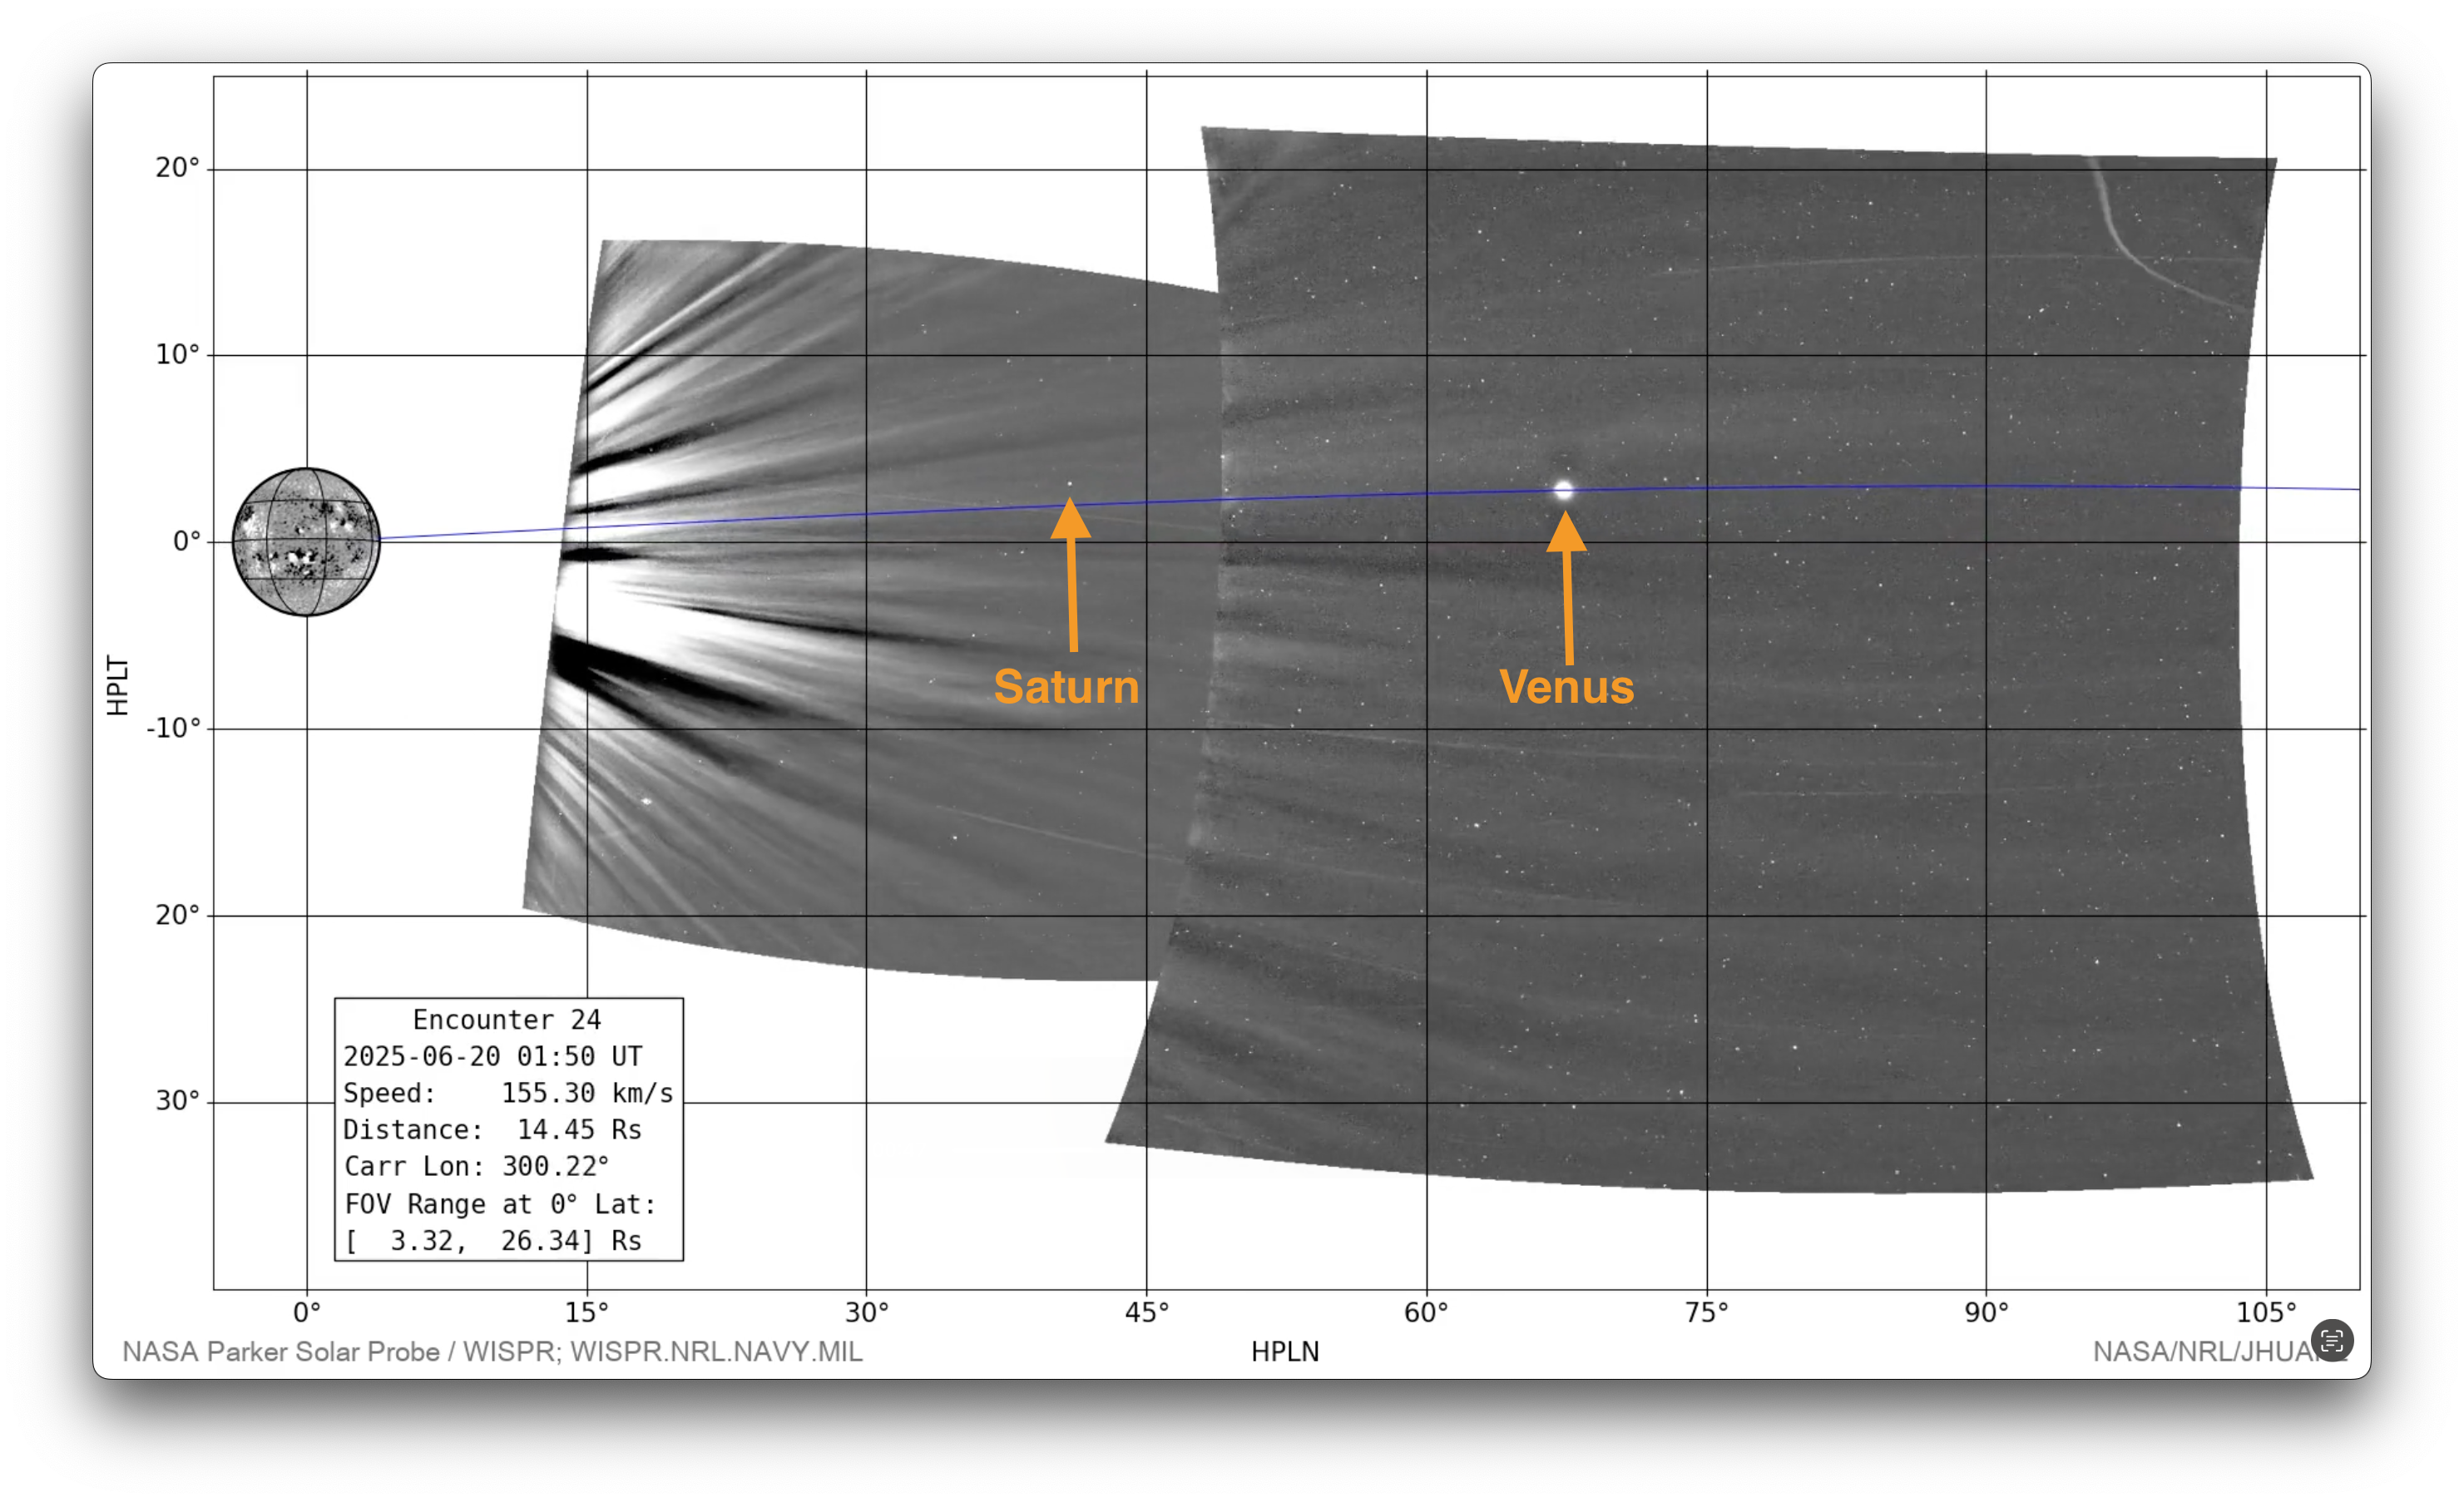
Encounter 24 (2025-06-09 - 2025-06-30, with limited additional data 2025-06-06 - 2025-07-02)
This animation shows all L3 WISPR full-field observations from the twenty-second PSP Mission Encounter (2025-03-18 - 2025-03-27). We have superimposed a grid showing helioprojective longitude and latitude, and a scale representation of the size and location of the Sun in the observations using the SDO/HMI Carrington map for this time period. The velocity and distance metrics displayed on the movies correspond respectively to the spacecraft's heliocentric velocity in kilometers per second, and its distance from the Sun's center in units of solar radii (where 1 solar radius = 695,700km). The "FOV Range" label provides the plane-of-sky distance limits of the inner and outermost edges of the fields of view, in units of solar radii. The horizontal blue line indicates the orbital plane of PSP. The timespan of this composite movie covers only the nominal science window when the spacecraft was within 0.25 au; a limited amount of data outside of this range may be available at the below links.
You can download this movie directly as an 105MB mp4 file. This sequence is also available as data processed via the LW Algorithm developed by Dr. Guillermo Stenborg (JHUAPL) and detailed in Appendix A of Howard et al. 2022 (ApJ, 936, id.43. DOI 10.3847/1538-4357/ac7ff5). Please contact the team for access to this data, which will be posted here one year after the acquisition of those observations. Team contact information can be found in Section 1.2 of the WISPR User's Guide [PDF link].
[Credit: NASA/NRL/JHUAPL. Movie processed/compiled by Guillermo Stenborg (JHUAPL) and Karl Battams (NRL). SDO inset courtesy of NASA/SDO and the AIA, EVE, and HMI science teams.]
Solar Features
TBD
Comets and planets
A few Kreutz sungrazers are visible, along with two small "non-group" comets. Their exact identities still to be determined.
On June 20, from the start of the day through 22:00 UT, WISPR-I images were taken in full detector resolution (1920x2048) instead of the normal 2x2 binning employed for most science observations (the 960x1024 images). The different resolutions introduce complications for the processing of higher level data products as a consistent set throughout the orbit, so binned L2 versions of these full-resolution files were created such that there would be a single, synoptic data set. These binned files have been placed inside in the L2/20250620 directory alongside the rest of the data for that dat. The original, full resolution L2 files can be found in L2/20250620/fullres. If you download the L2 zip file linked below, the full-resolution files are included in there. All L2b, L3 and LW fits files, as well as movies and pngs, are based only on the binned L2s -- there are no L2b or L3 files for the full-resolution data.
Furthermore, on 2024-06-19, between 09:00 and 11:00 UT, a new experimental schedule was run to test a low gain mode in the outer telescope, to support shorter exposure times in the inner telescope around perihelion with a unique ‘region’ code in the filename ‘2212’ (compared to the standard products of ‘2222’ and ‘2302’). While successful, this schedule was not used in subsequent orbits, as it was decided that the longer exposure times it required in the outer telescope could potentially introduce motion blur. Instead, a new observing program was created that combined low gain short exposure images in the inner telescope and the standard, high gain images in the outer telescope.
Before the initial E24 data release, these images were inadvertently not processed to level 2 and higher, leaving a two-hour gap in the originally released data for the outer telescope around perihelion. Upon discovery of this oversight, the L2s for this period were created and used to produce L3, L2b and LW products. Because the various methods to generate the backgrounds for these latter products require a series of images in time, images previously released around the two-hour low-gain period were used to help determine the backgrounds of the new images. After confirming that the intensity levels of the original and new images were not significantly impacted by the inclusion of the previously missing files, it was decided that the originally released data would remain in place, and the new images taken during the low-gain period would be the only products released from this procedure.
As a final note, in the new outer telescope images from this two-hour period, a number of horizontal streaks are visible in the L3 and LW images. This is due to a known difference in the detector when between low and high gain modes. Similar features can be seen in the inner telescope L3 and LW products at gain mode changes in prior orbits. In longer periods of low gain observing, the number of images can be used to limit the impact of these features. With just a two-hour period of images taken in this specific mode, there is not enough data to diminish these streaks, leaving them throughout the images.
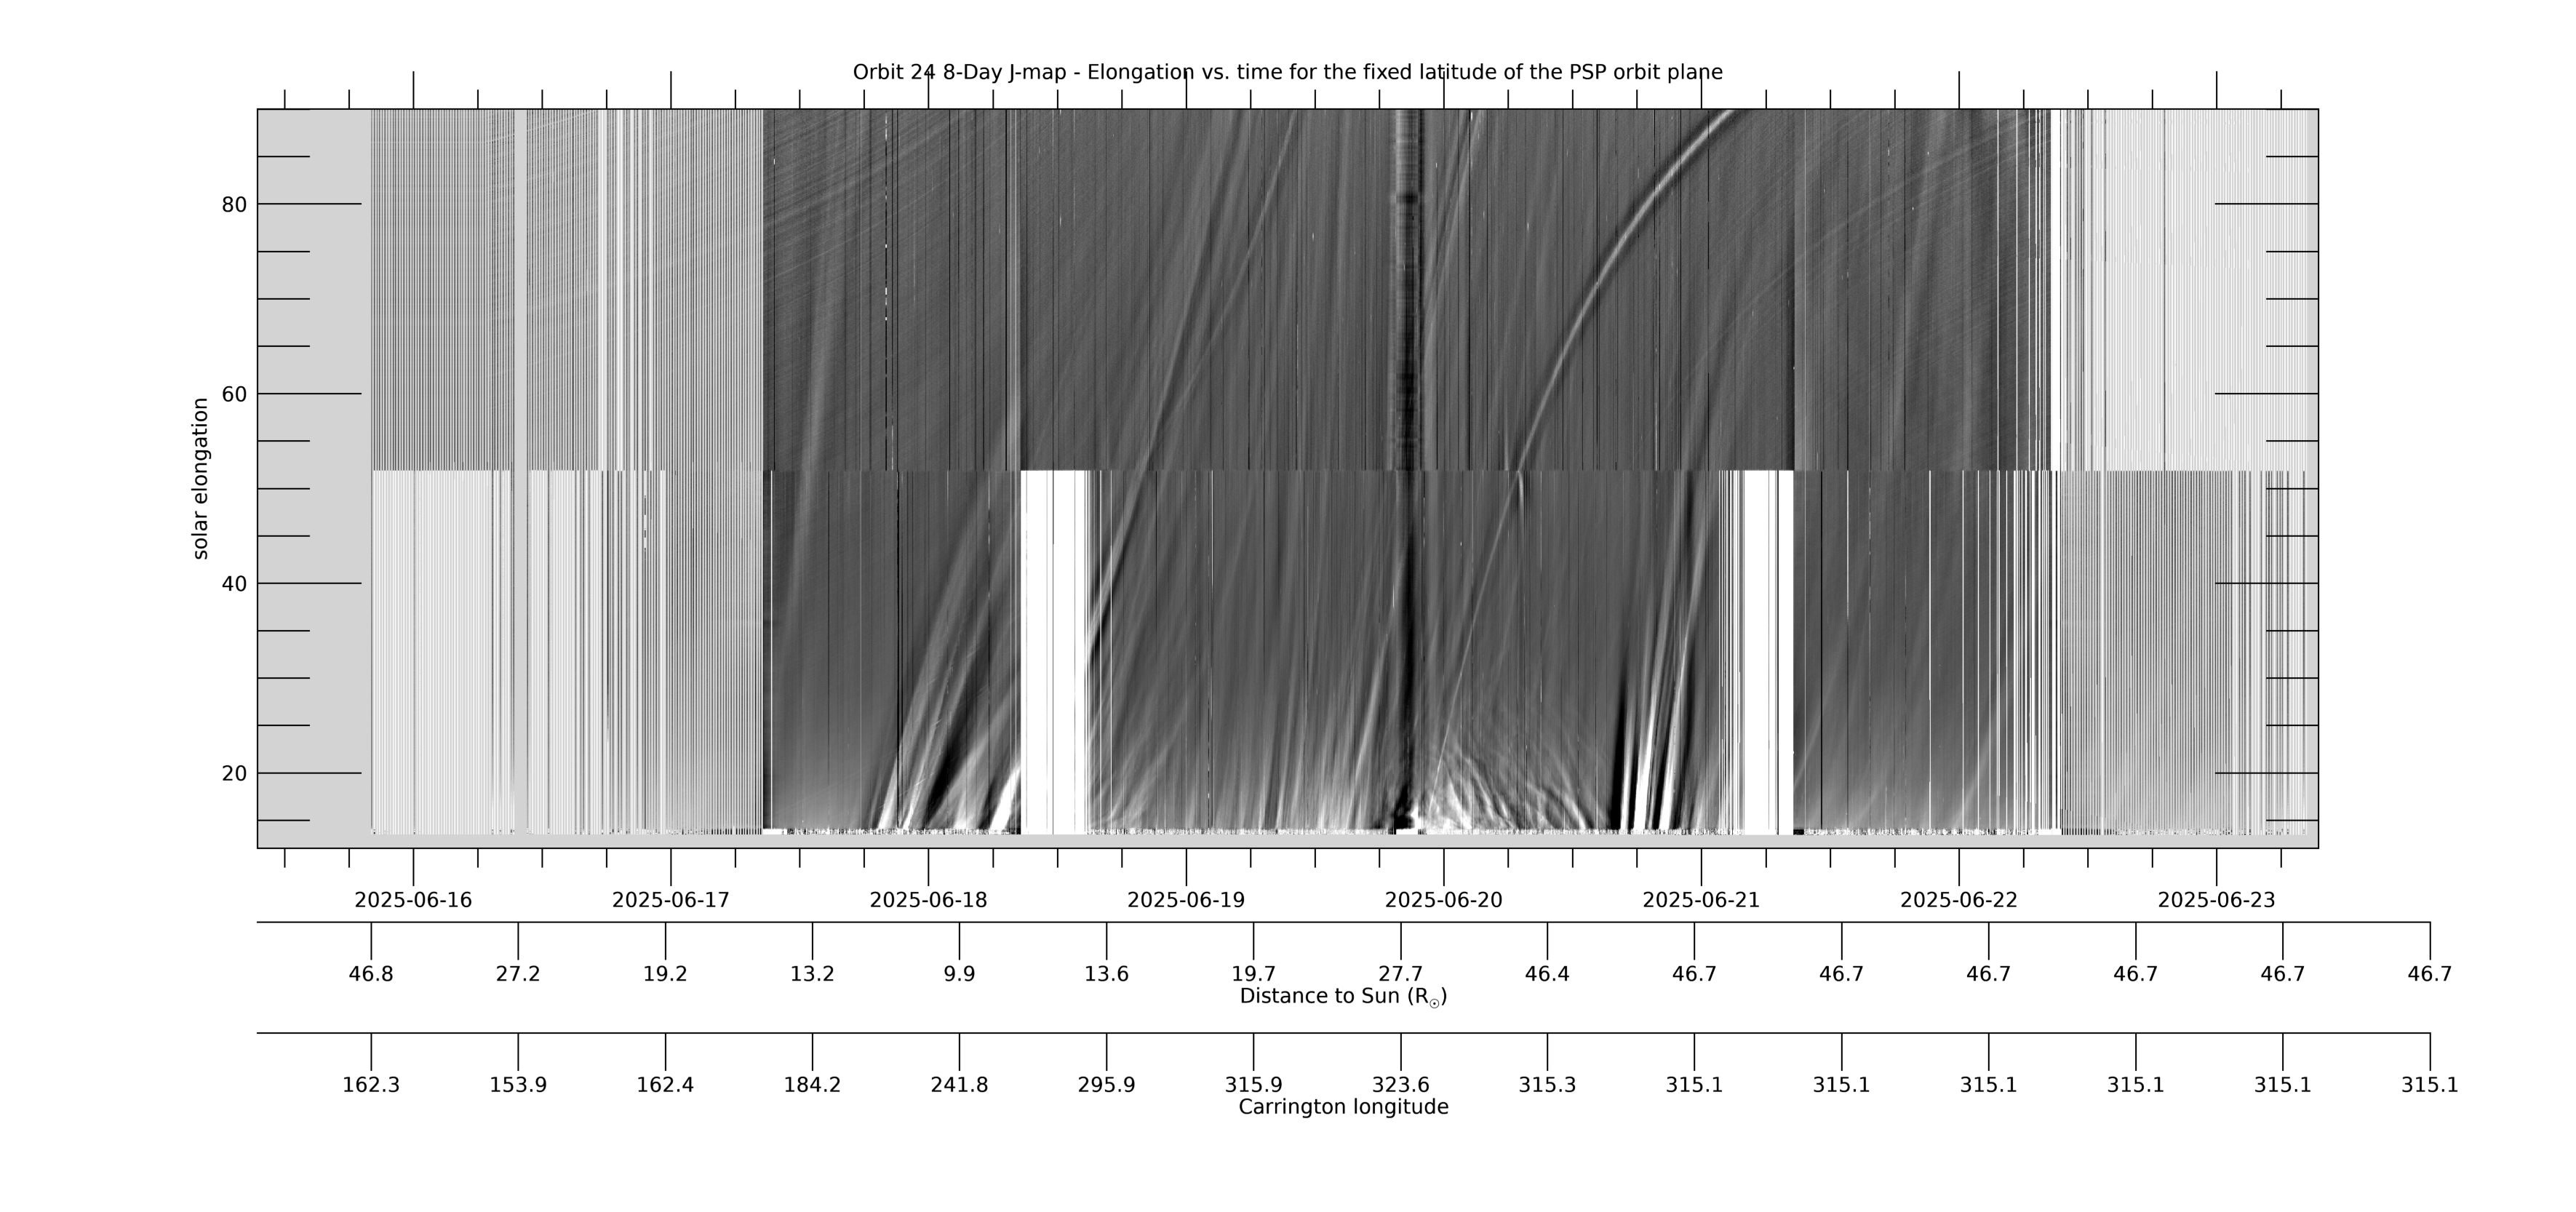
[ABOVE] This 8-day WISPR J-map shows solar elongation (angle from the Sun center) versus time at a fixed latitude measured relative to the PSP-Venus orbit plane. It is created from composite LW-processed full field-of-view (FOV) composite images such as those in the LW movie above, in which the PSP-Venus orbit plane is marked with a blue line. For each image (each time), data is collected along the PSP-Venus orbit plane for the full range of elongations in the WISPR FOV. The collected data is then stacked in time (x-axis) with elongation as the y-axis. The WISPR movies at this web site can be used to identify and find the cause of the various features seen in the J-map. Below the time axis are two additional axes showing PSP’s distance to the Sun RP and its Carrington longitude at that time. The time span in this and subsequent maps is centered on the time of perihelion. [Credit: NASA/JPL. Data processed by Paulo Penteado (JPL/Caltech).]
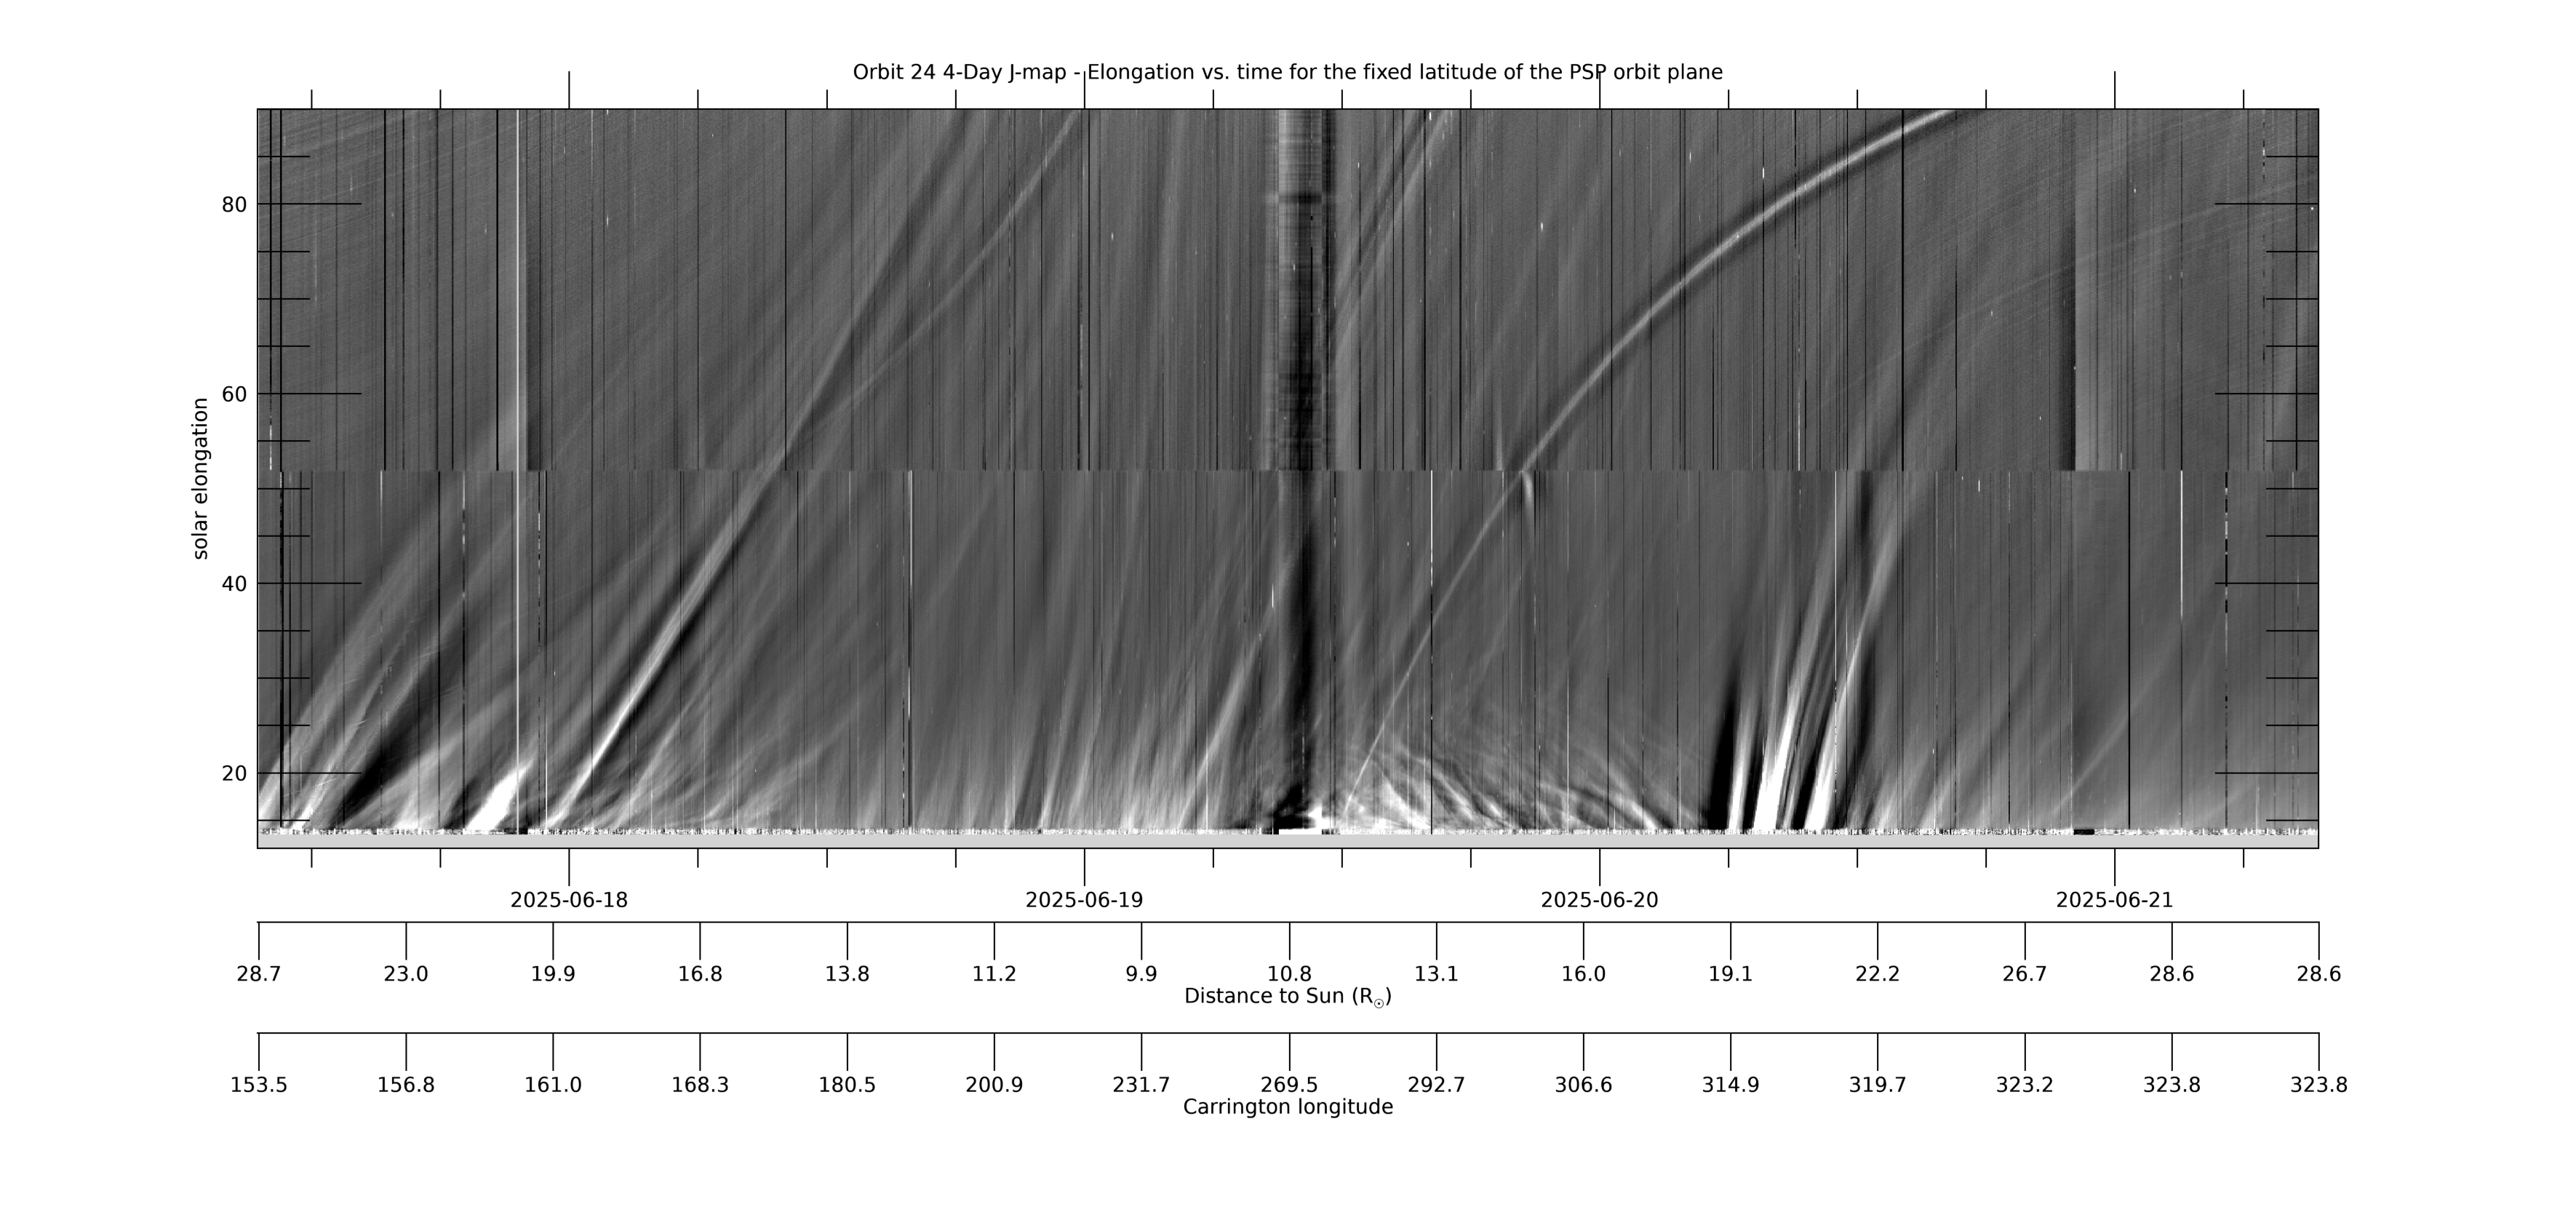
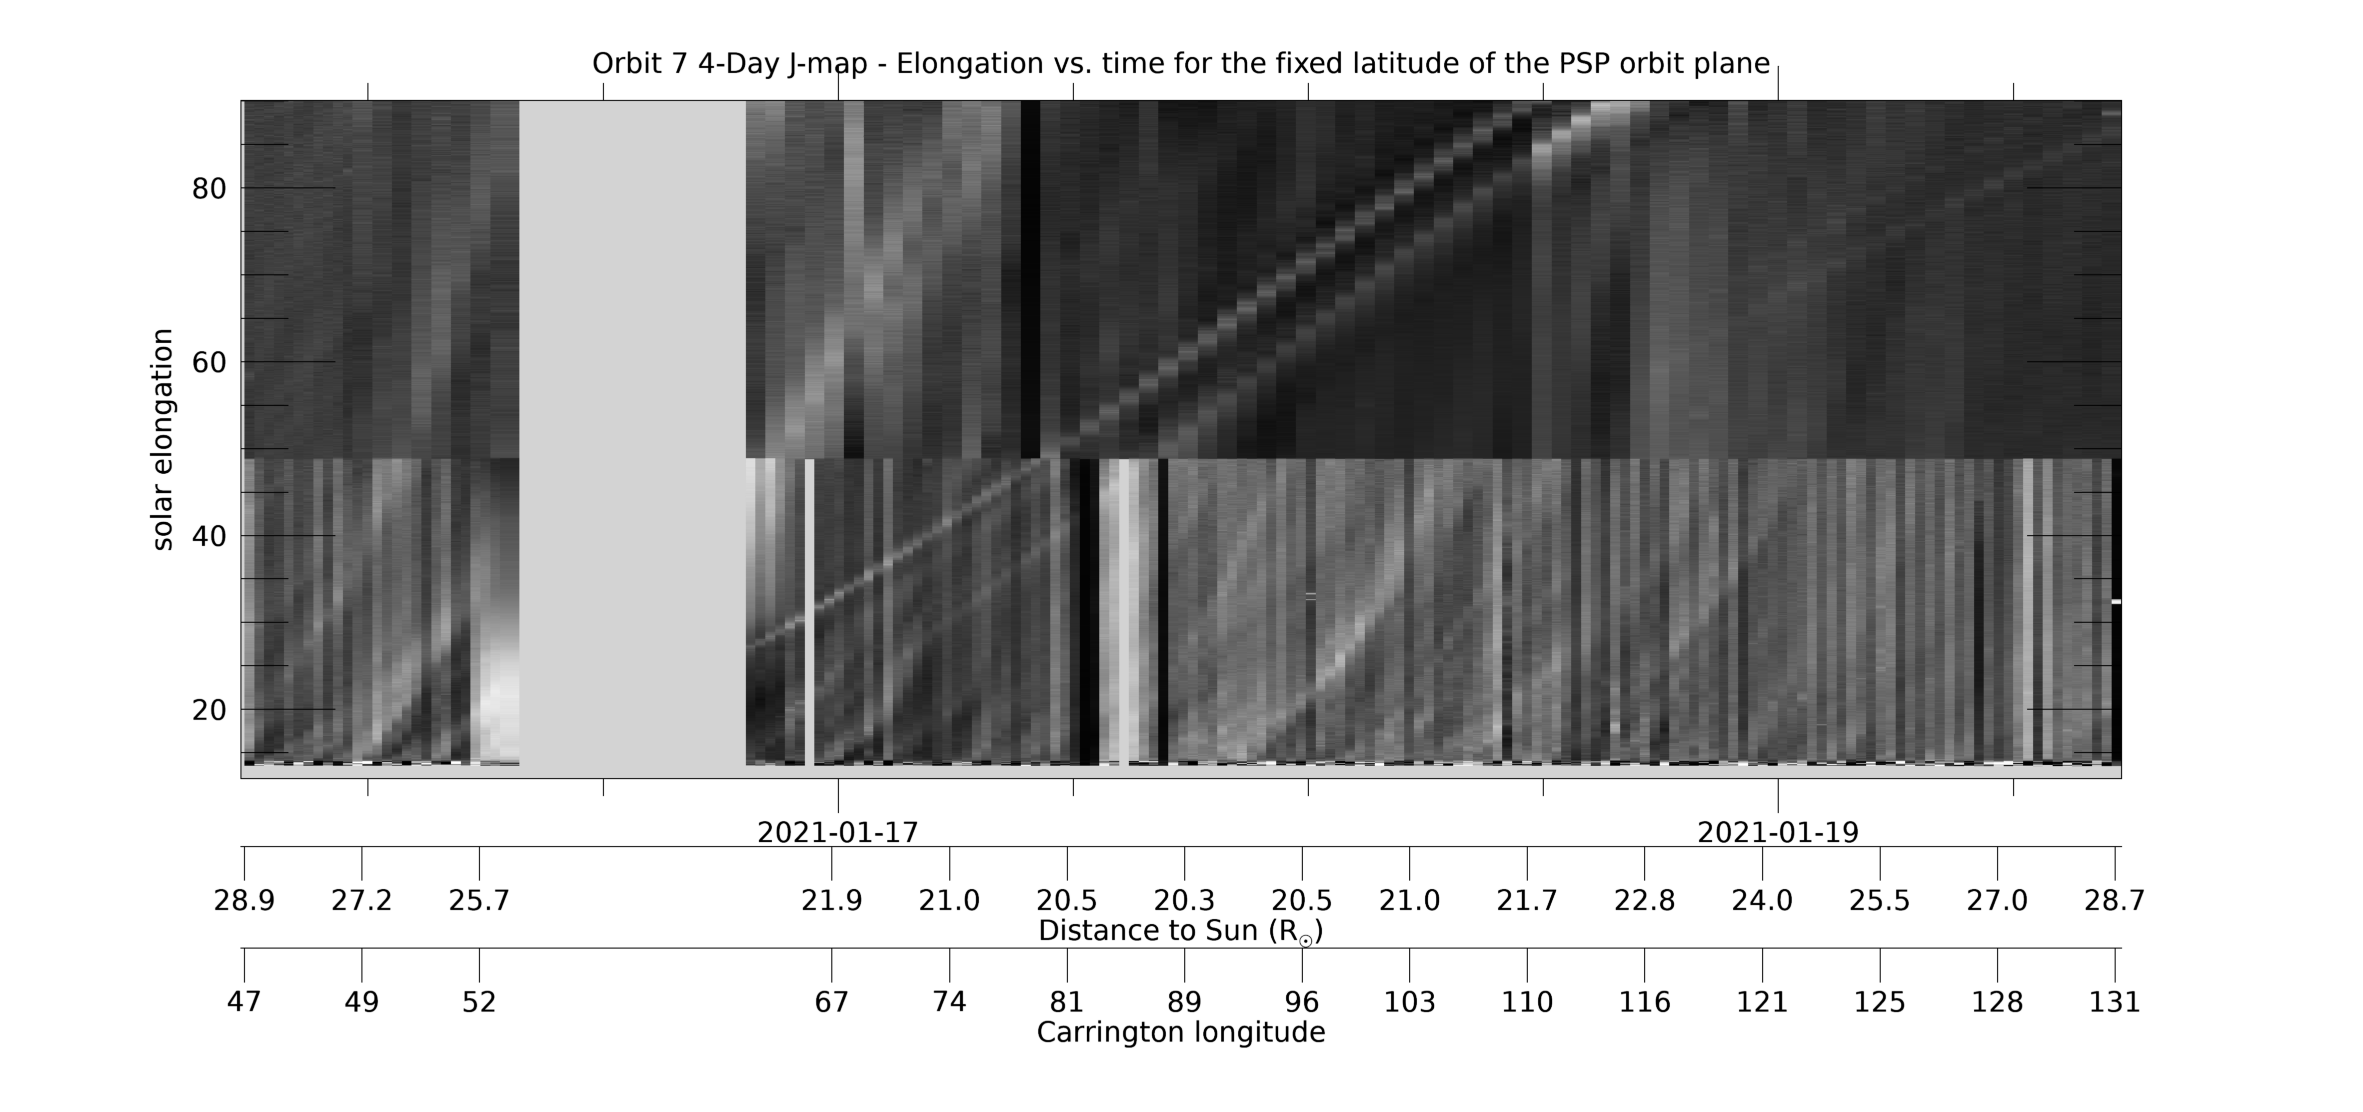
[ABOVE] This 4-day WISPR J-map uses the same data as the 8-day J-map above, but shows only 4 days, centered on perihelion, and only includes distances to 25 R☉ to provide better resolution. See the caption above for more information. [Credit: NASA/JPL. Data processed by Paulo Penteado (JPL/Caltech).]
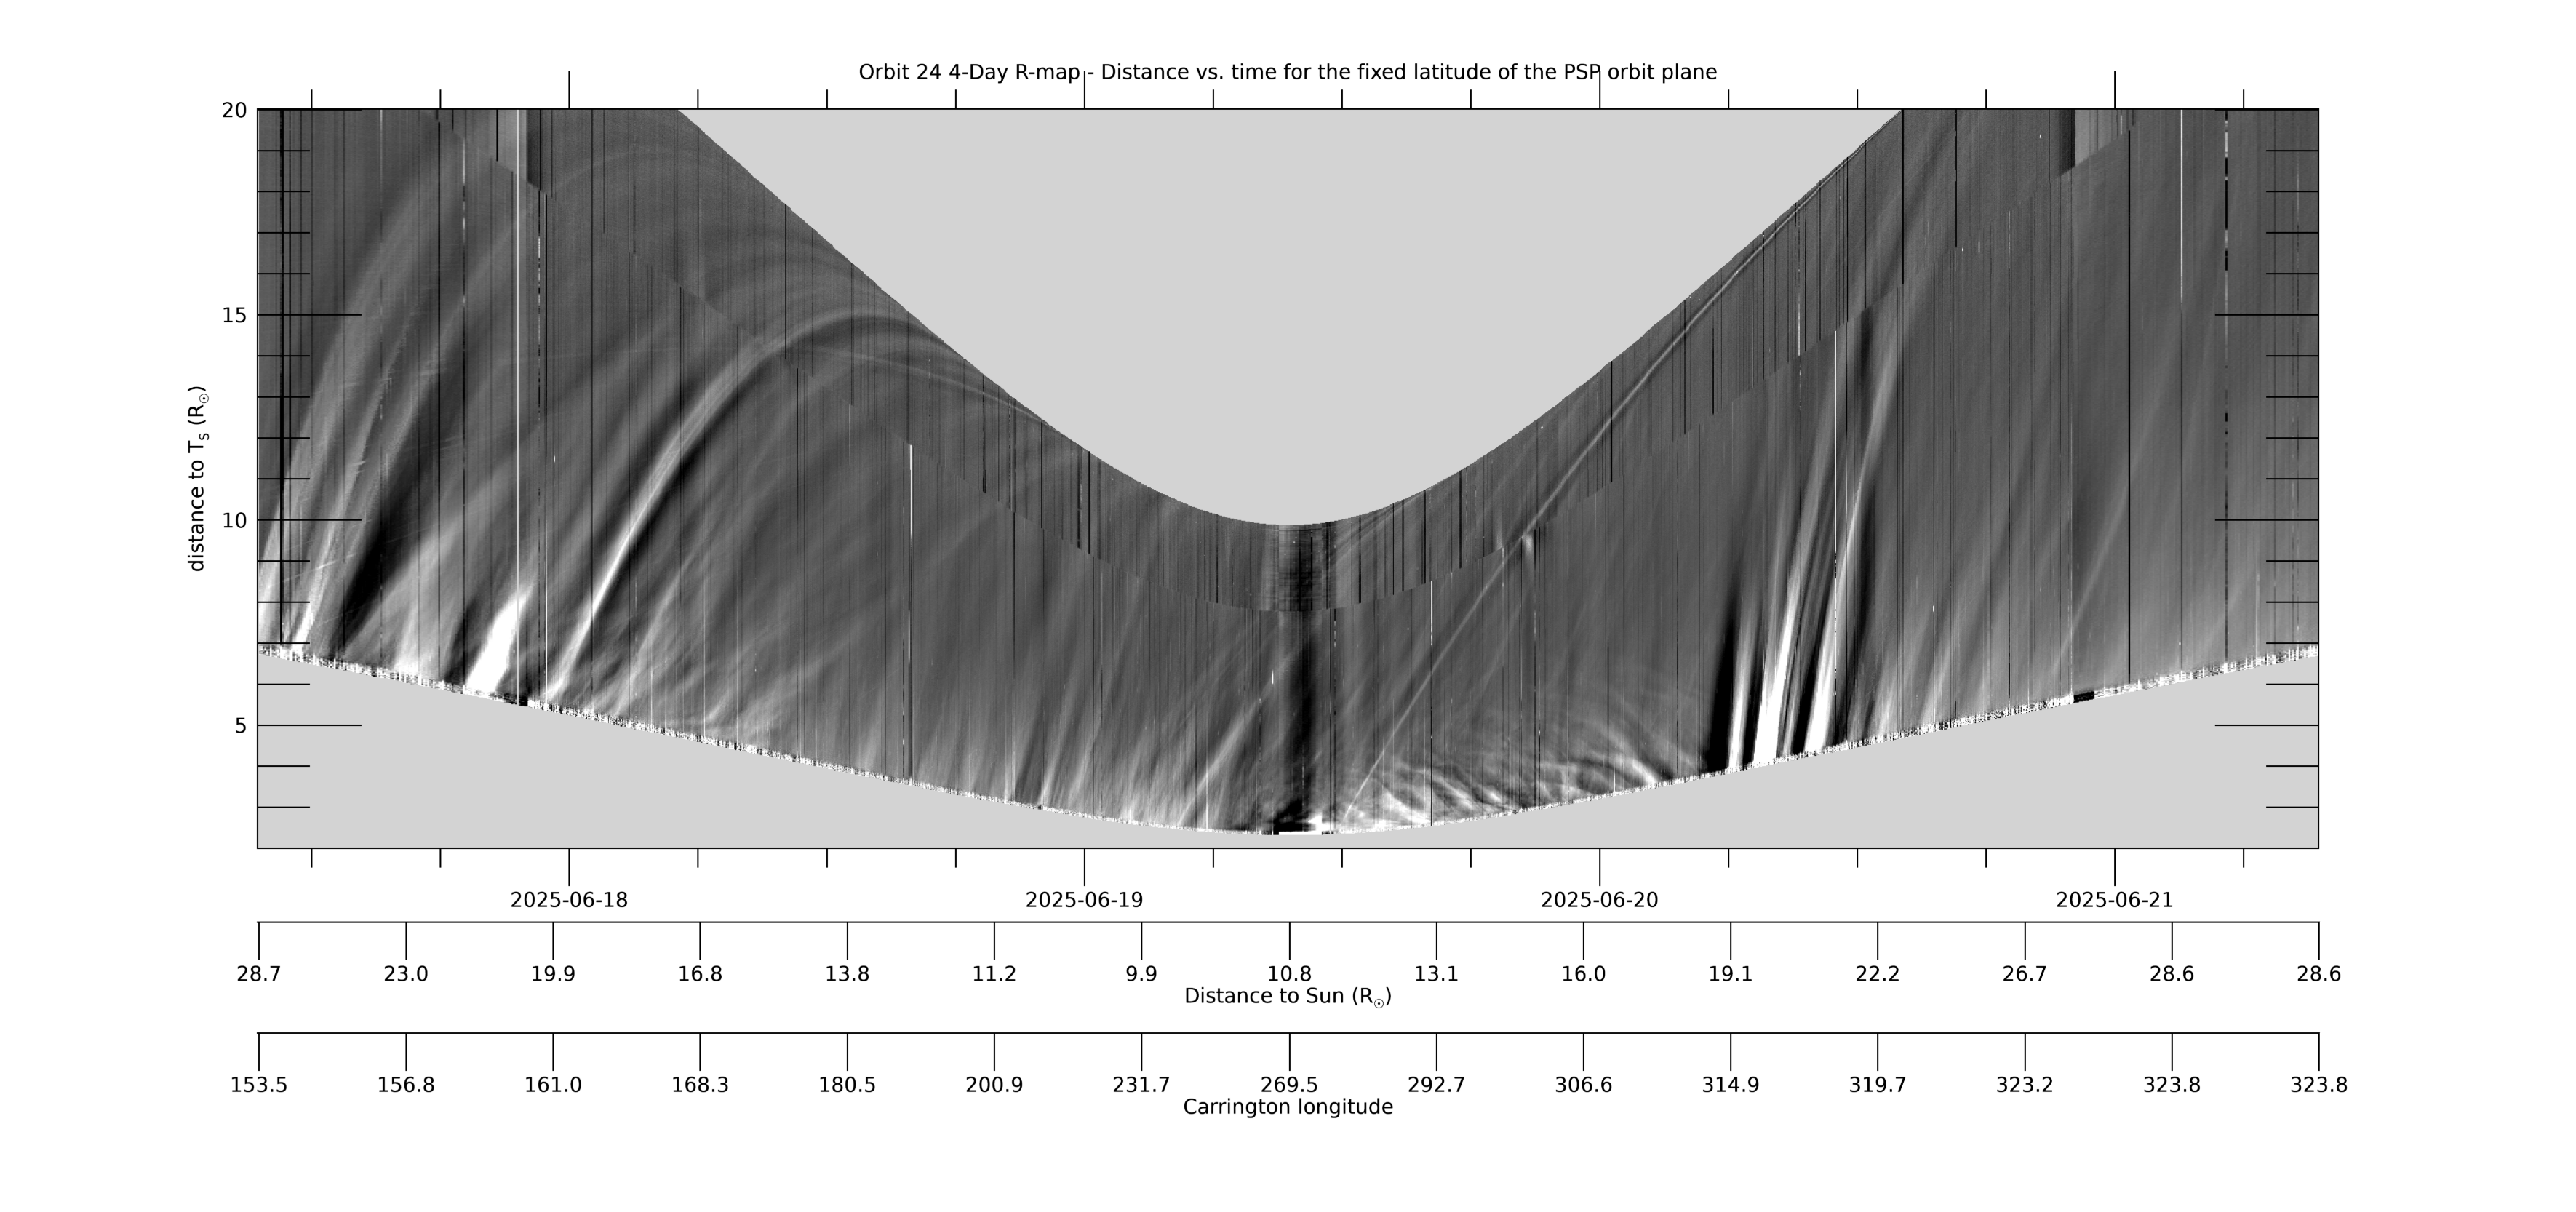
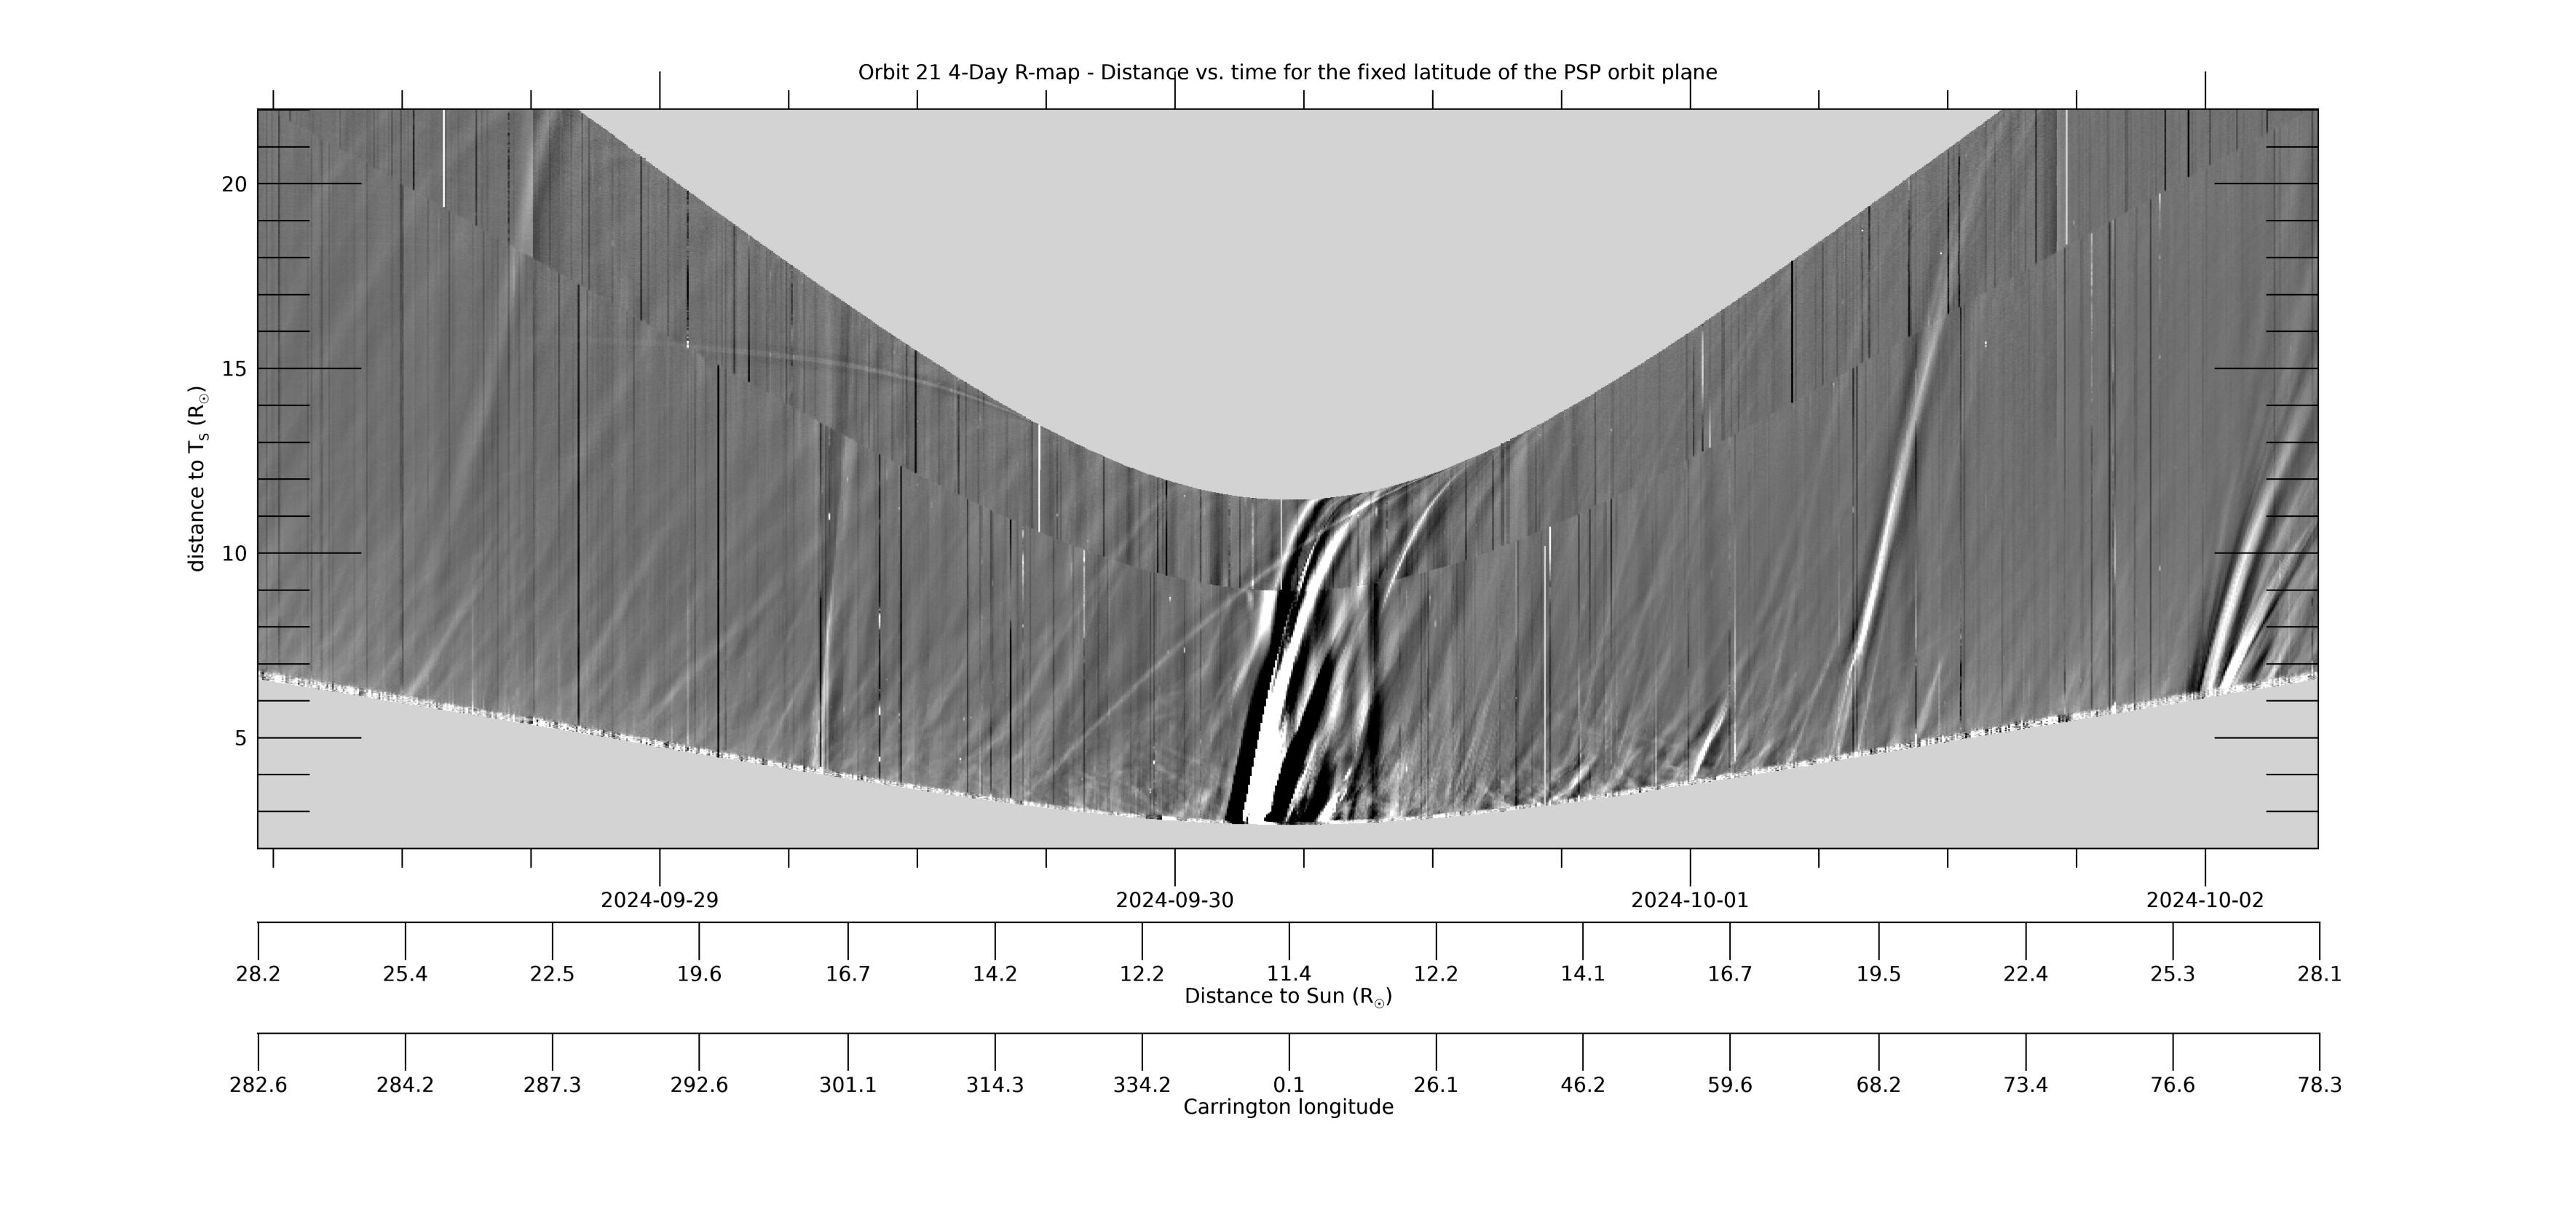
[ABOVE] This 4-day R-map uses the same data as the 4-day J-map (the data collected at each time/image along the PSP-Venus orbit plane), but makes the assumption that the (line-of-sight integrated) signal at each solar elongation all comes from where that line-of-sight hits the Thomson sphere, which is the location of maximum sensitivity of a white light telescope (see, e.g., Vourlidas & Howard, 2006, ApJ,642,1216; DOI: 10.1086/501122). This distance RT (the new y-axis) is related to the elongation by RT=RP*sin(elongation), where RP is PSP’s distance to the Sun. The R-map can be considered a “height-time” plot with and such maps can be used to estimate of the velocity of the observed transients. The LW composite movie above can be used to identify and find the cause of the various features seen in the R-map. Only data up to 90° has been included. [Credit: NASA/JPL. Data processed by Paulo Penteado (JPL/Caltech).]
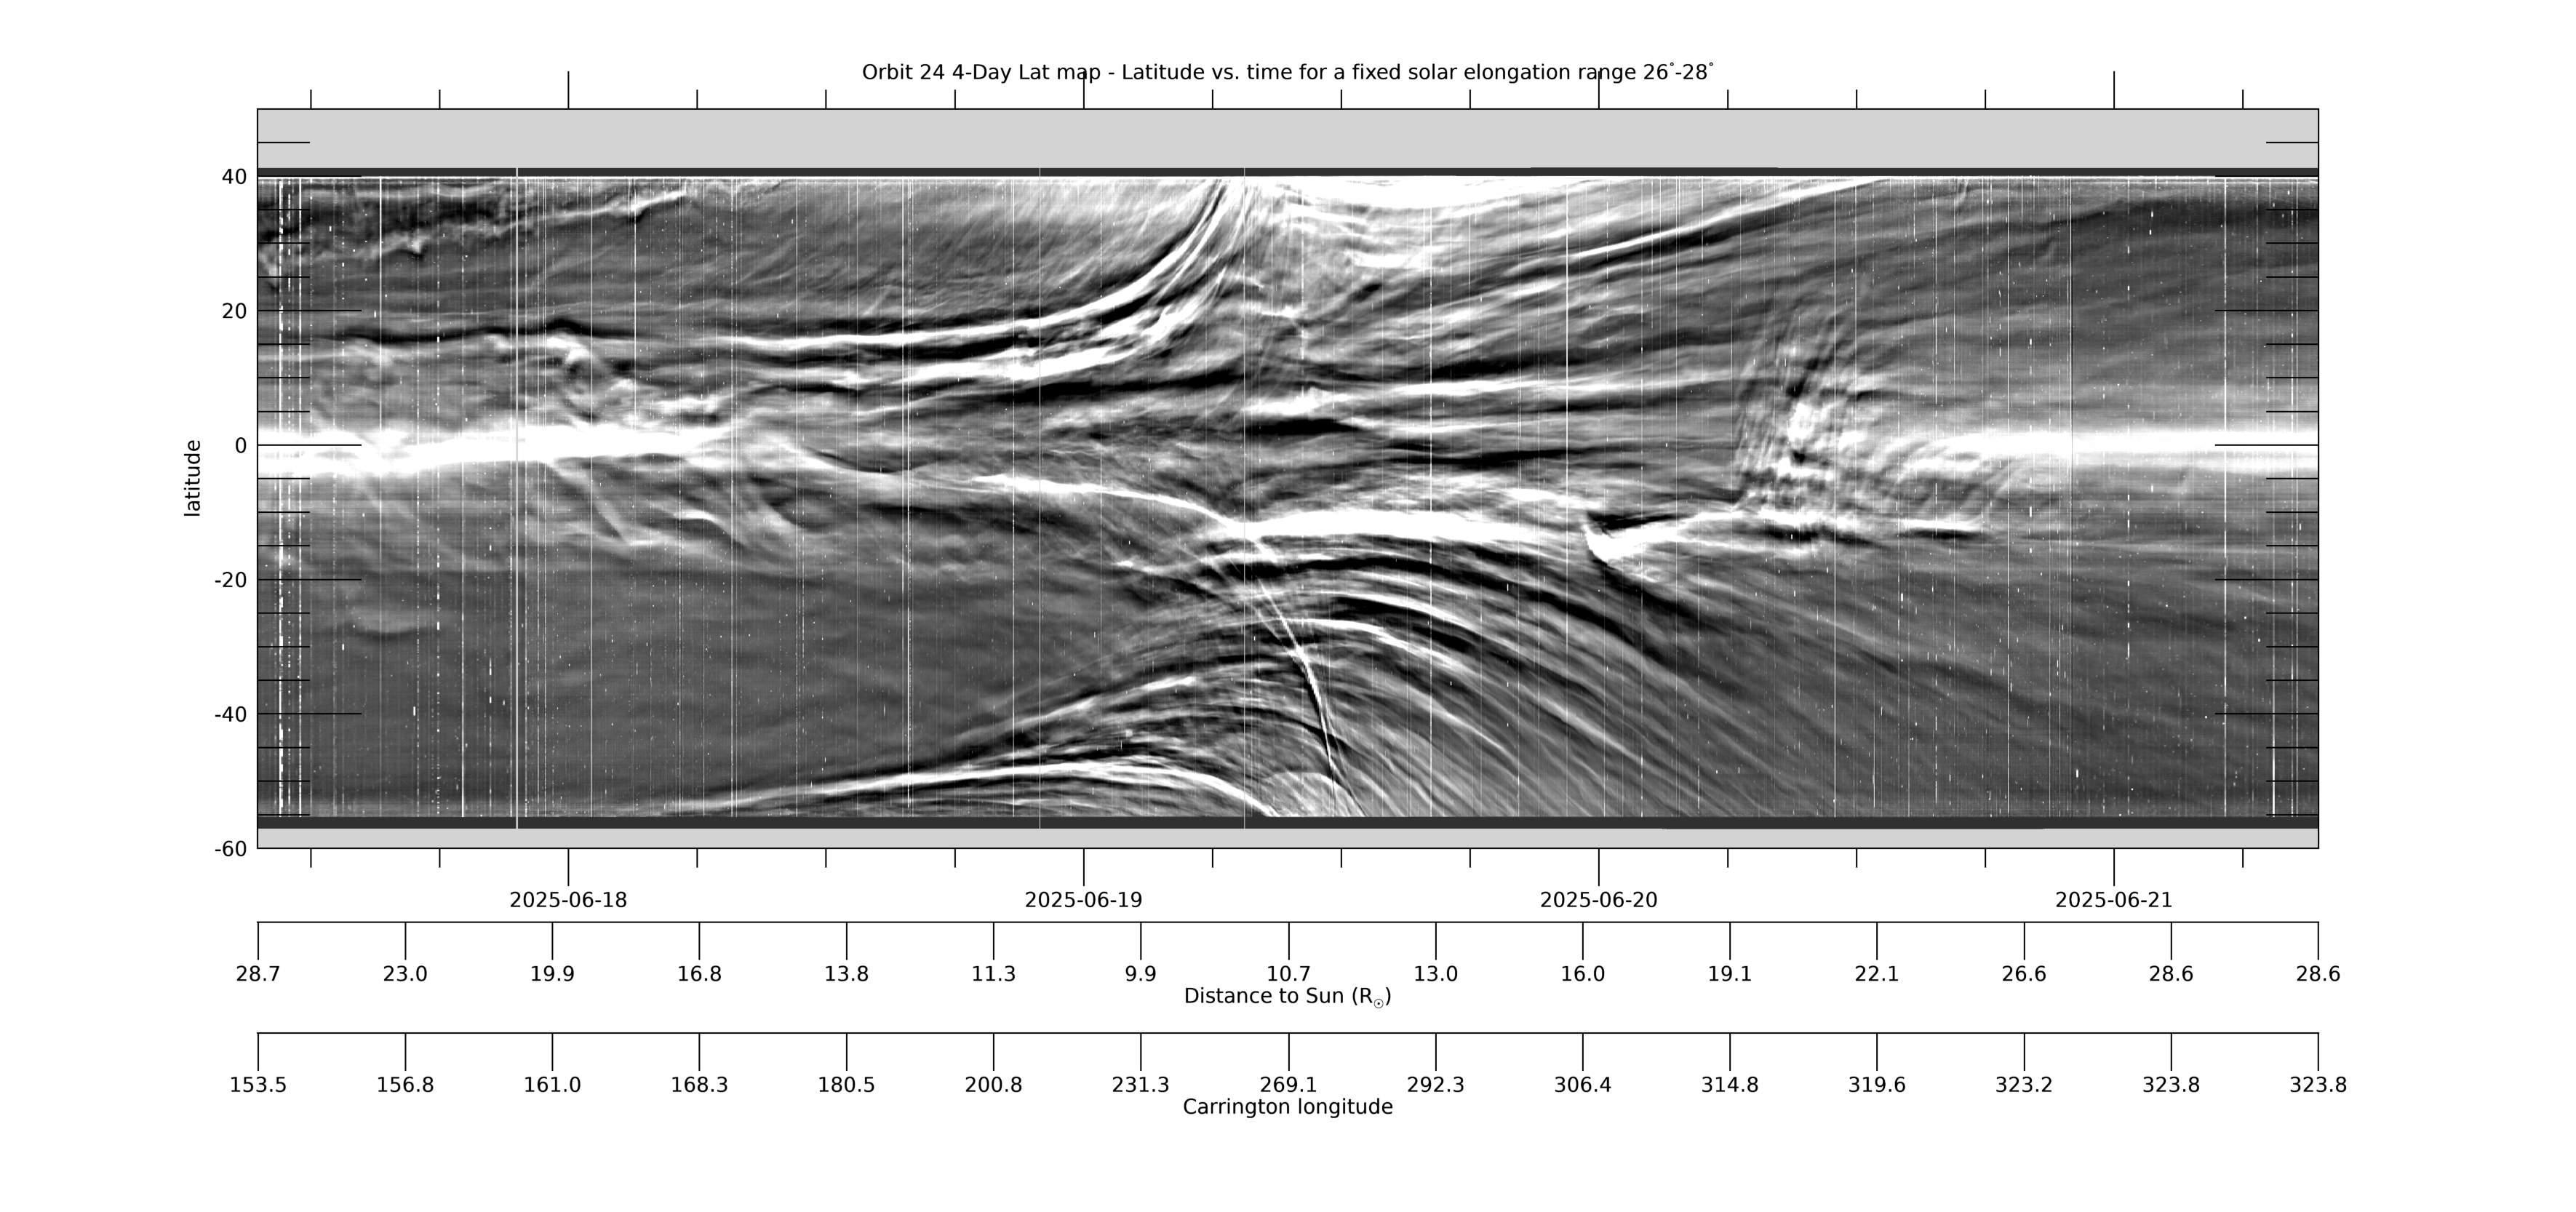
[ABOVE] This 4-day Lat-map shows the evolution in latitude, measured from the PSP-Venus orbit plane, for a fixed solar elongation of 26°-28°. The map is created from L3-processed images by collecting the arc of data in the WISPR-I FOV in the range 26°-28°elongation from each image and stacking the data horizontally in time (for details, see Liewer et al, 2023; DOI: 10.3847/1538-4357/acc8c7). Near perihelion when PSP is moving faster than the Sun rotates, quasi-stationary coronal rays may show large changes in apparent latitude as they approach and pass over or under the spacecraft. The map was created using L3 processed images. The L3 movies at this web site can be used to identify features seen in the Lat-map. [Credit: NASA/JPL. Data processed by Paulo Penteado (JPL/Caltech).]
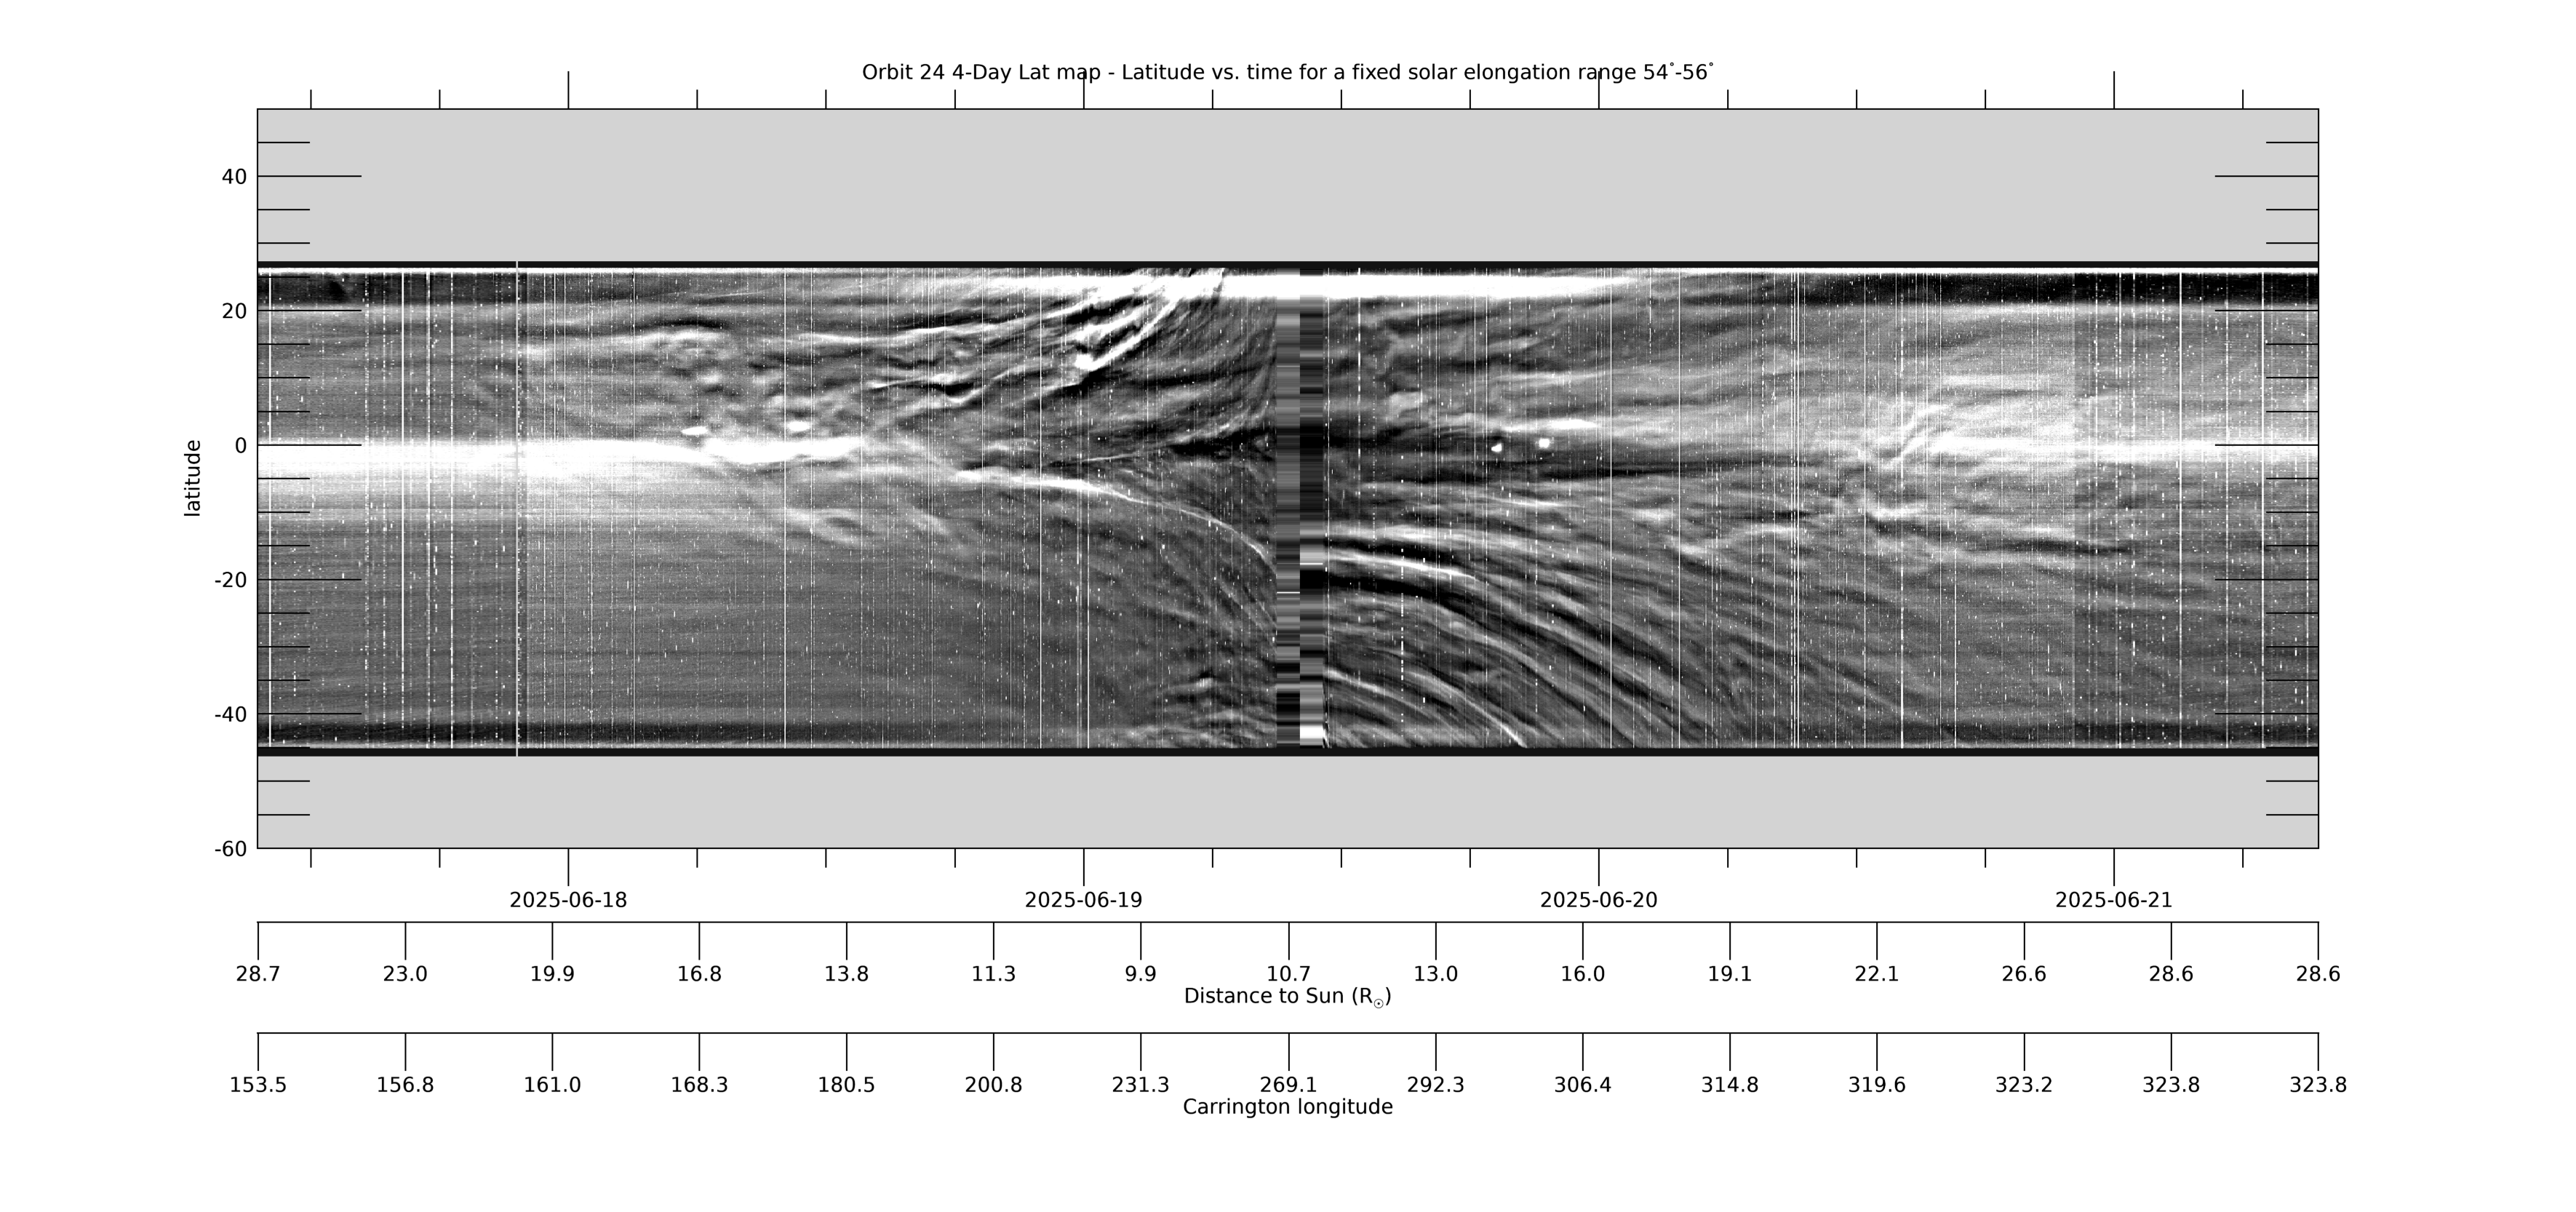
[ABOVE] This 4-day Lat-map shows the evolution in latitude, measured from the PSP-Venus orbit plane, by collecting the arc of data in the WISPR-O FOV for a fixed solar elongation range of 54°-56°. It is made in the same way as the WISPR-I Lat-map above. See that caption for more information. [Credit: NASA/JPL. Data processed by Paulo Penteado (JPL/Caltech).]
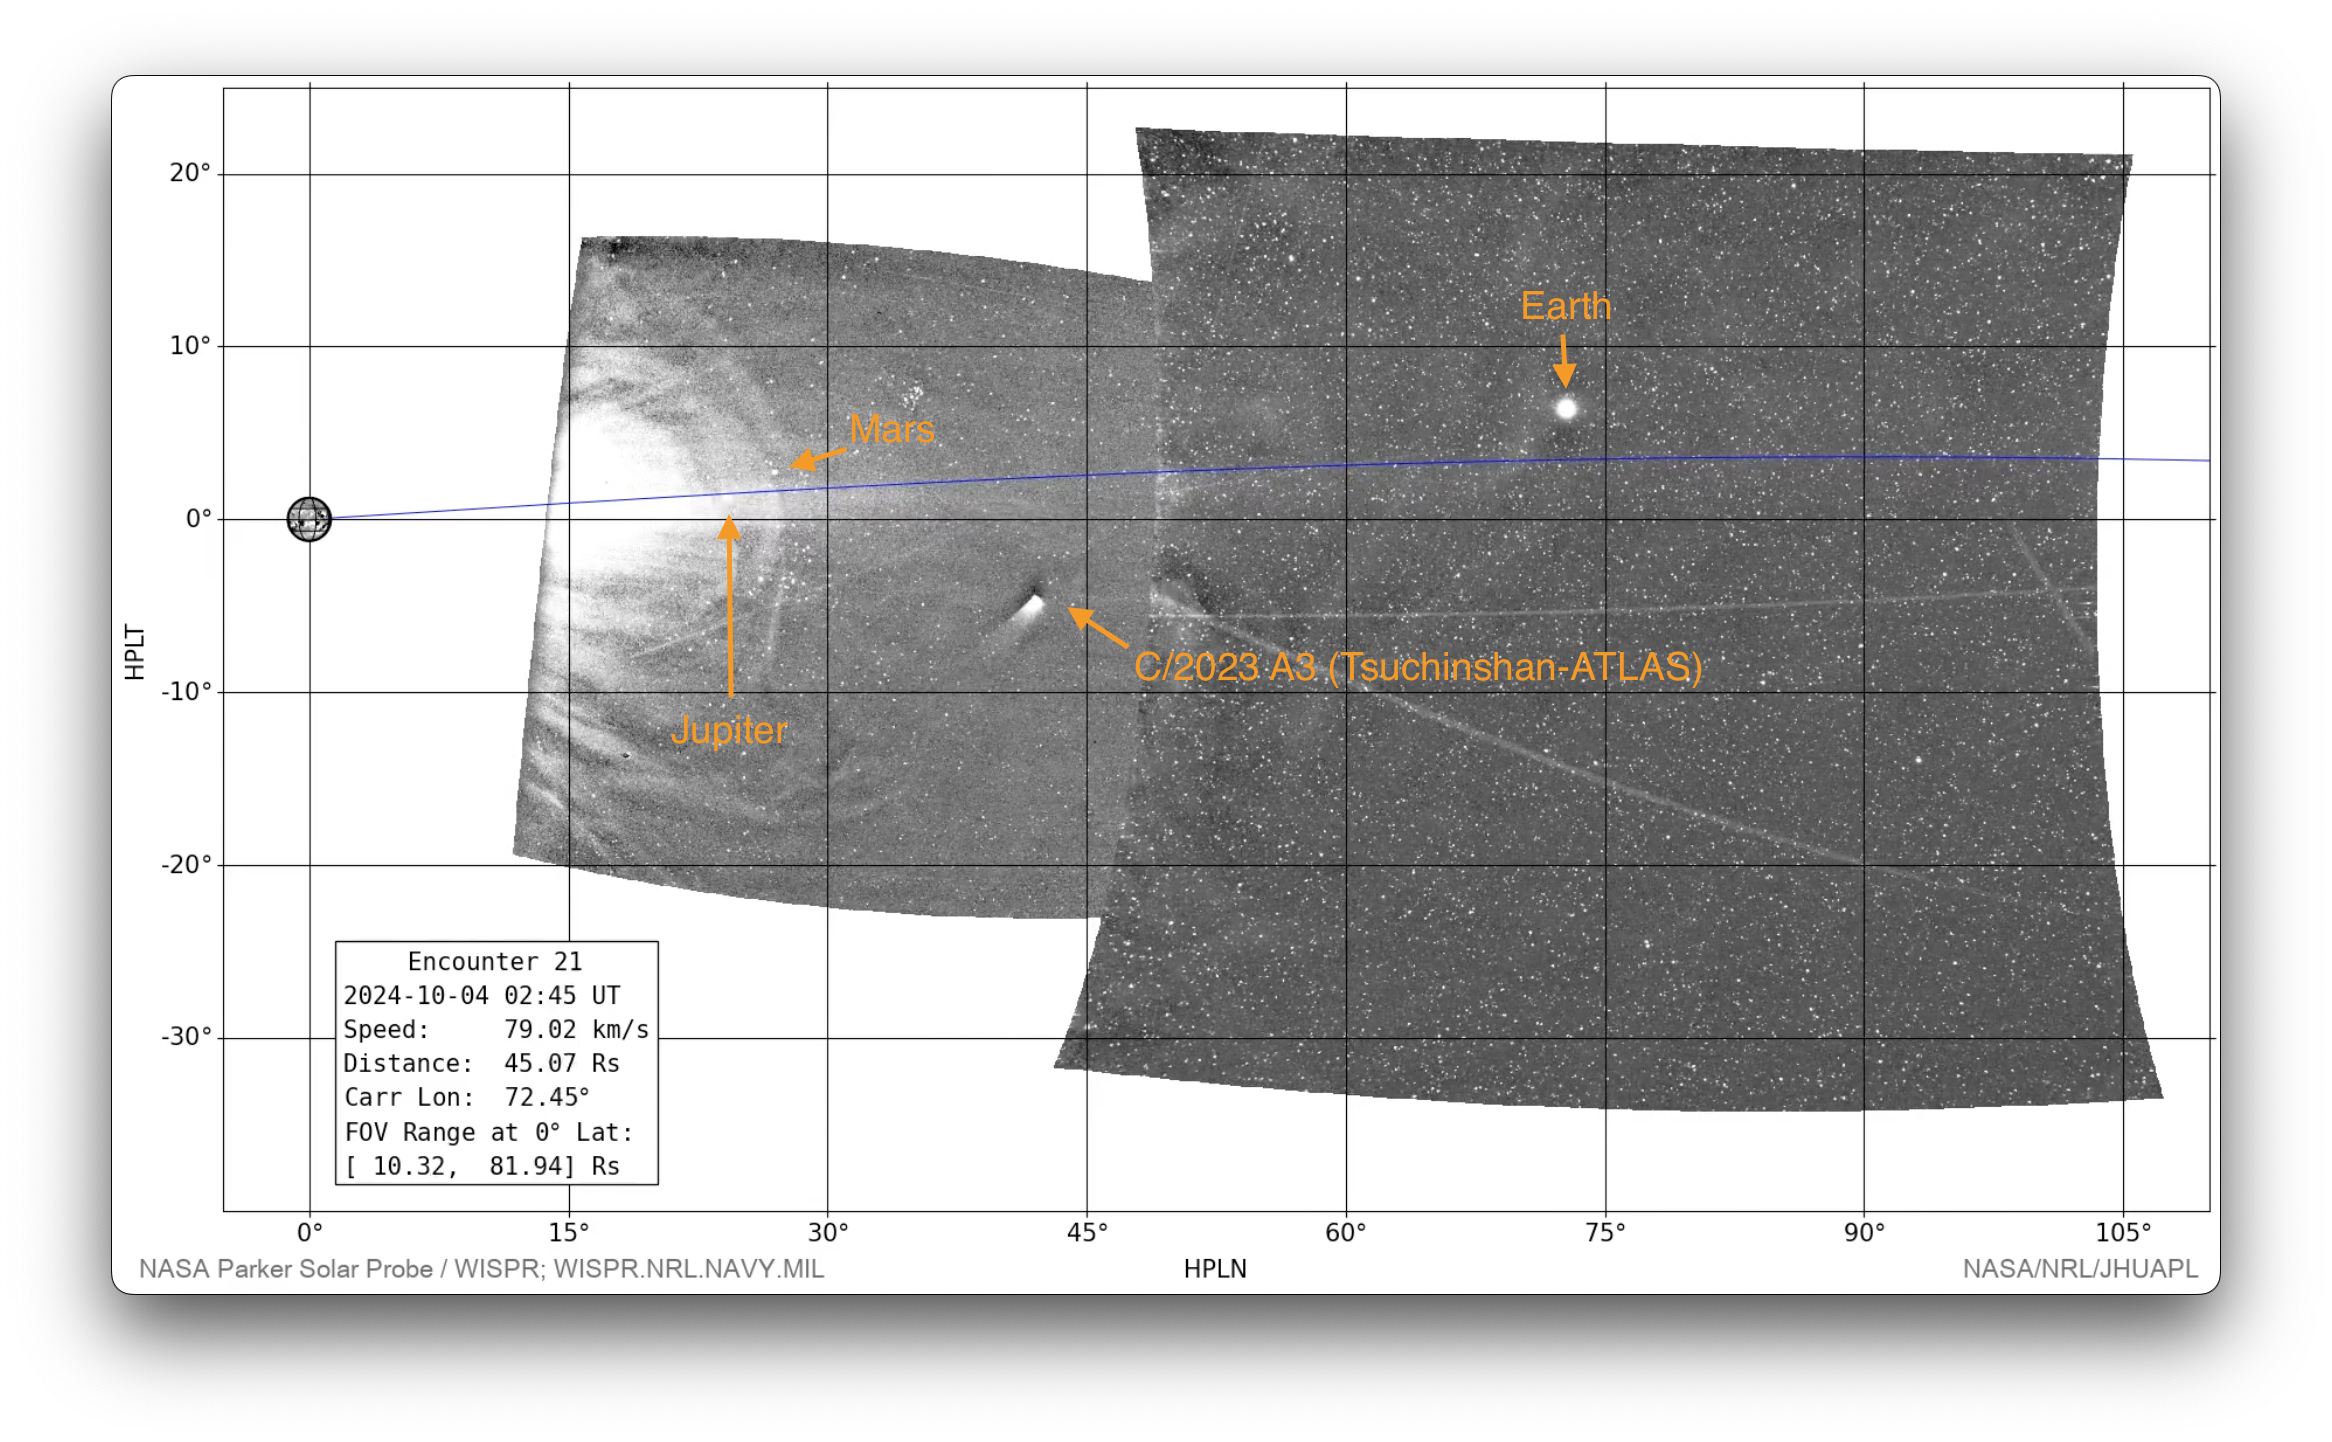
Encounter 21 (2024-09-25 - 2024-10-05, with limited additional data 2024-09-22 - 2024-10-06)
This animation shows all L3 WISPR full-field observations from the twenty-first PSP Mission Encounter (2024-09-25 - 2024-10-05). We have superimposed a grid showing helioprojective longitude and latitude, and a scale representation of the size and location of the Sun in the observations using the SDO/HMI Carrington map for this time period. The velocity and distance metrics displayed on the movies correspond respectively to the spacecraft's heliocentric velocity in kilometers per second, and its distance from the Sun's center in units of solar radii (where 1 solar radius = 695,700km). The "FOV Range" label provides the plane-of-sky distance limits of the inner and outermost edges of the fields of view, in units of solar radii. The horizontal blue line indicates the orbital plane of PSP. The timespan of this composite movie covers only the nominal science window when the spacecraft was within 0.25 au; a limited amount of data outside of this range may be available at the below links.
You can download this movie directly as an 101MB mp4 file. This sequence is also available as a 556 MB mp4 file processed via the LW Algorithm developed by Dr. Guillermo Stenborg (JHUAPL) and detailed in Appendix A of Howard et al. 2022 (ApJ, 936, id.43. DOI 10.3847/1538-4357/ac7ff5). Please contact the team for access to this data, which will be posted here one year after the acquisition of those observations. Team contact information can be found in Section 1.2 of the WISPR User's Guide [PDF link].
[Credit: NASA/NRL/JHUAPL. Movie processed/compiled by Guillermo Stenborg (JHUAPL) and Karl Battams (NRL). SDO inset courtesy of NASA/SDO and the AIA, EVE, and HMI science teams.]
A number of Kreutz sungrazers are visible, with their exact identities still to be determined. Comet C/2023 A3 (Tsuchinshan-ATLAS) is visible in the WISPR-I observations from 2024-10-01 through to the end of the Encounter.
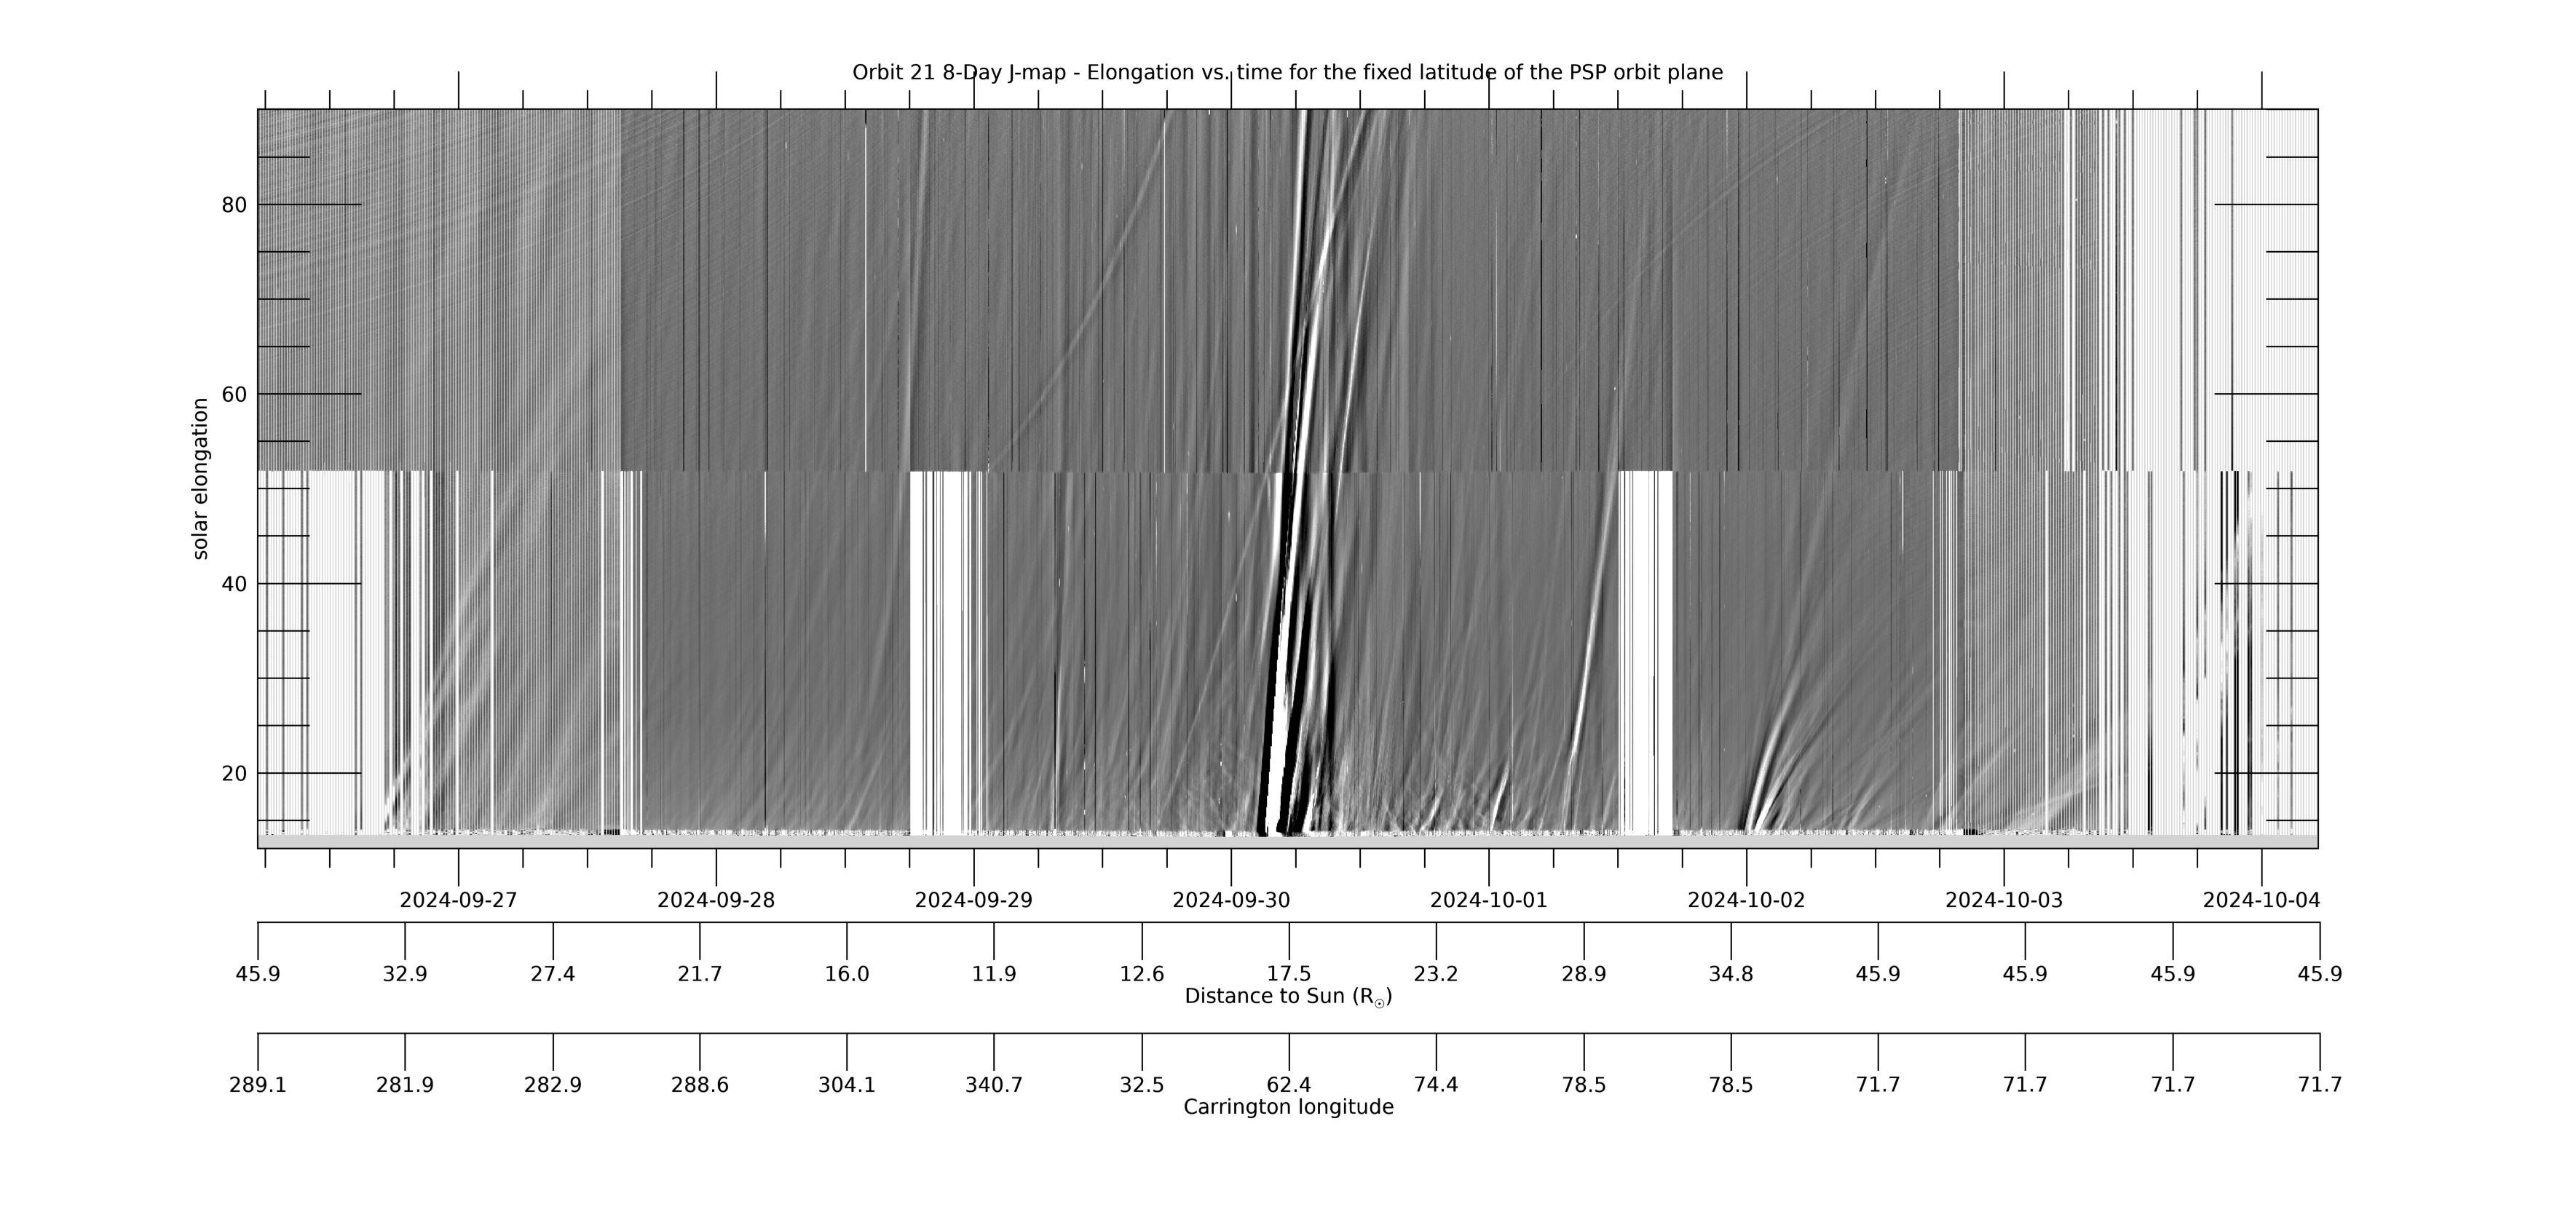
[ABOVE] This 8-day WISPR J-map shows solar elongation (angle from the Sun center) versus time at a fixed latitude measured relative to the PSP-Venus orbit plane. It is created from composite LW-processed full field-of-view (FOV) composite images such as those in the LW movie above, in which the PSP-Venus orbit plane is marked with a blue line. For each image (each time), data is collected along the PSP-Venus orbit plane for the full range of elongations in the WISPR FOV. The collected data is then stacked in time (x-axis) with elongation as the y-axis. The WISPR movies at this web site can be used to identify and find the cause of the various features seen in the J-map. Below the time axis are two additional axes showing PSP’s distance to the Sun RP and its Carrington longitude at that time. The time span in this and subsequent maps is centered on the time of perihelion. [Credit: NASA/JPL. Data processed by Paulo Penteado (JPL/Caltech).]
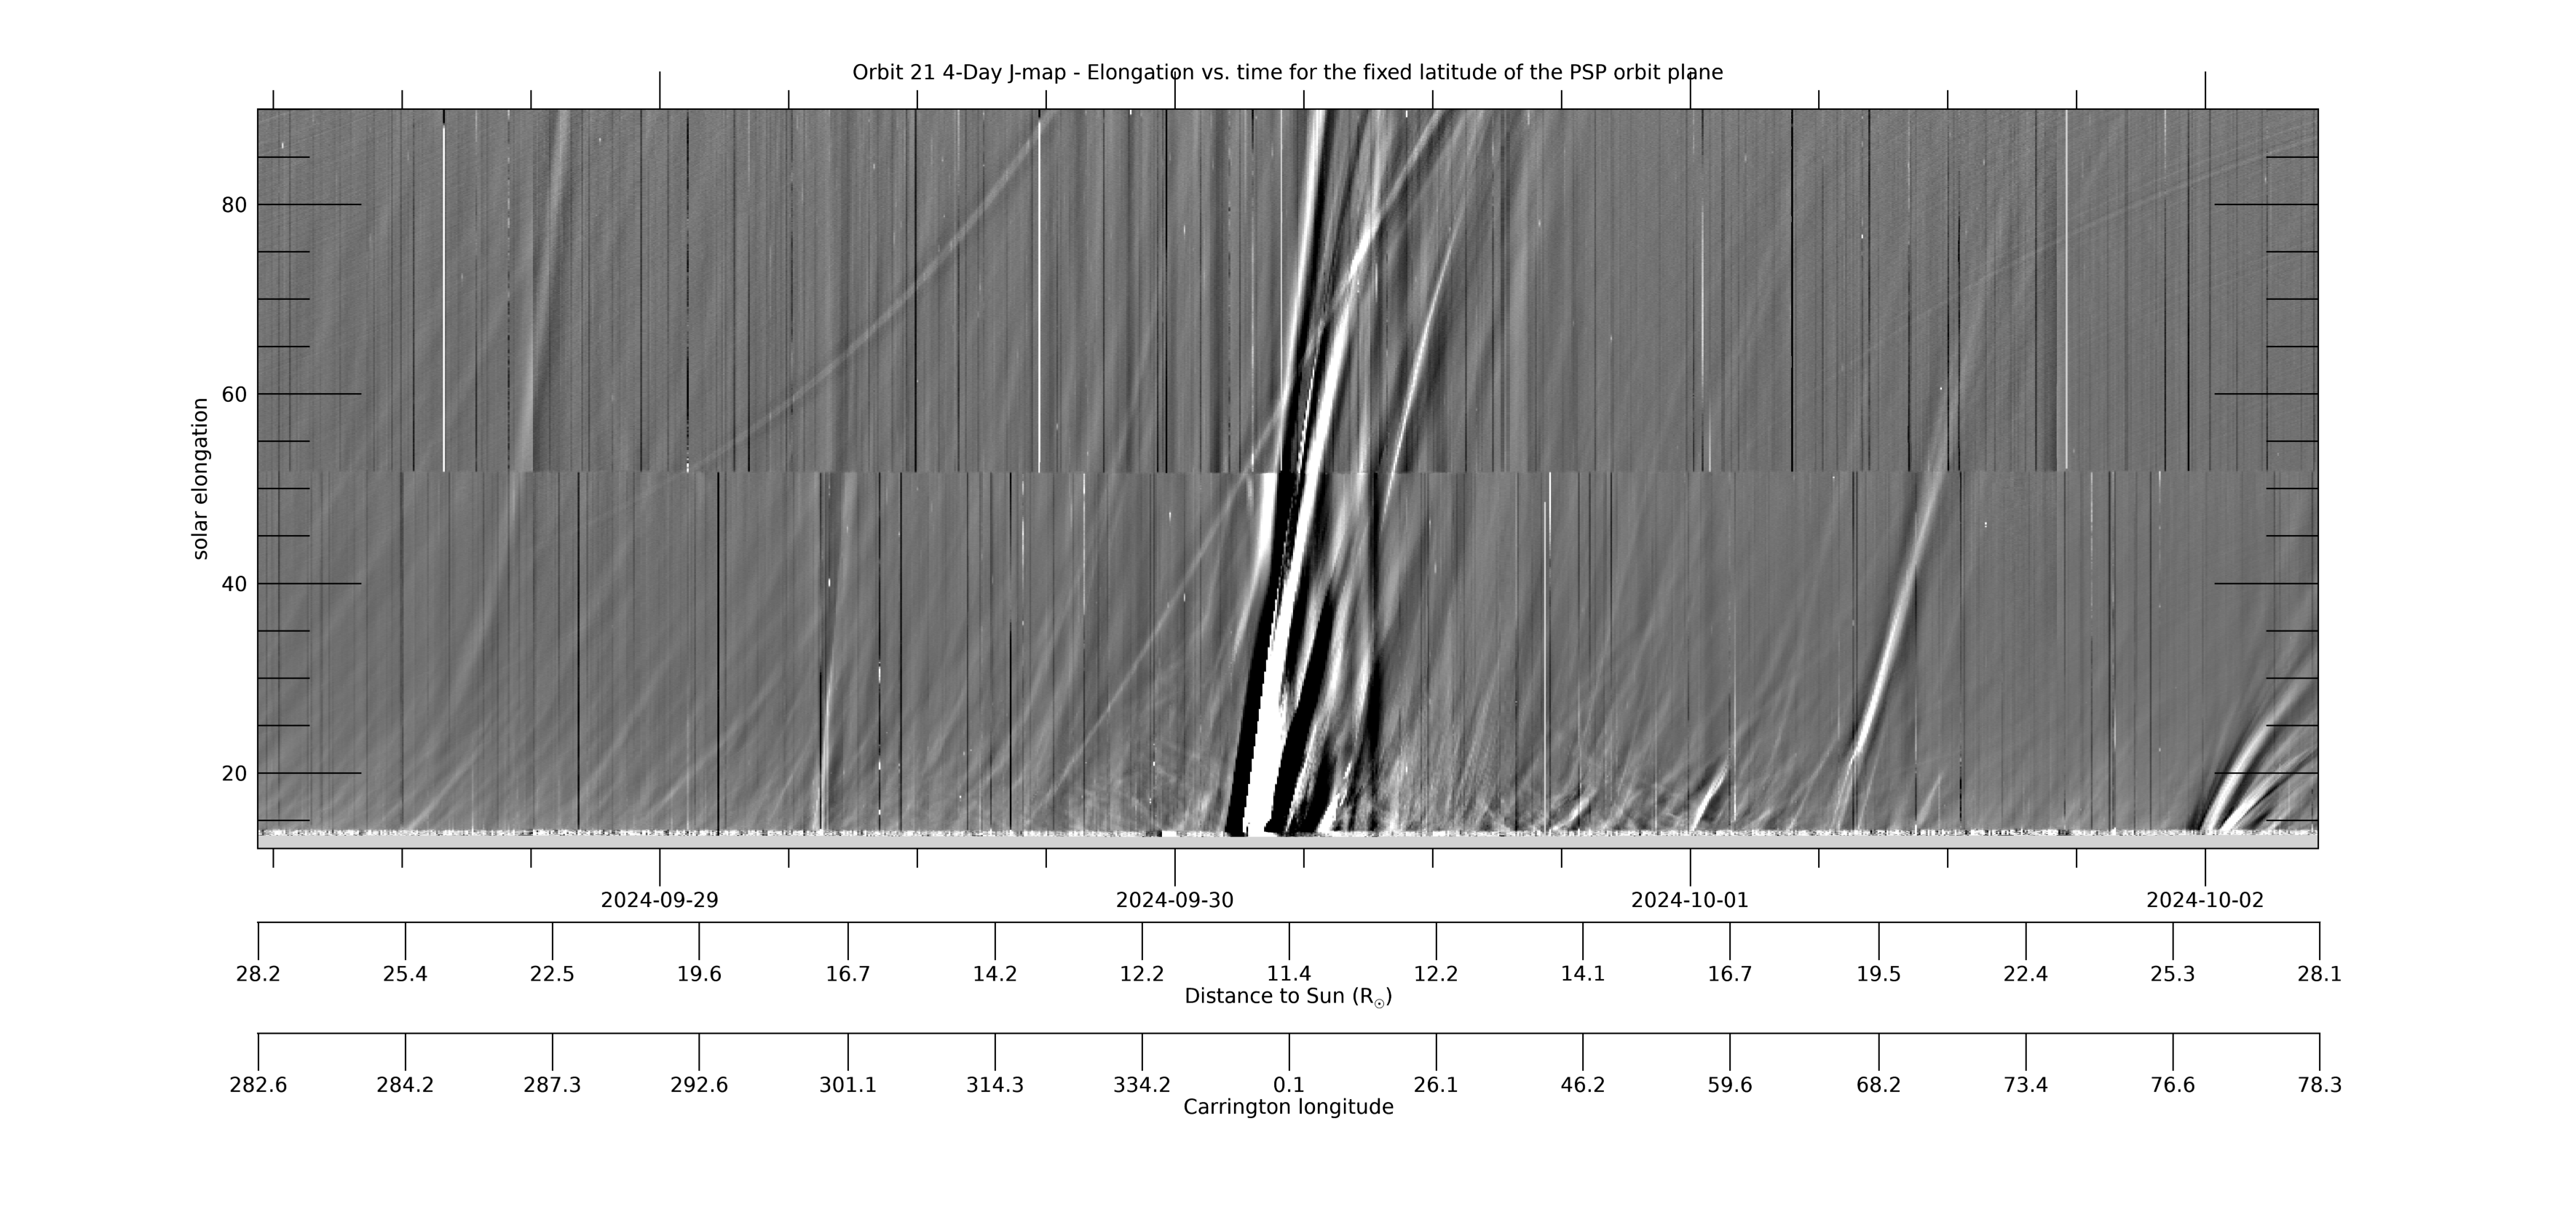
[ABOVE] This 4-day WISPR J-map uses the same data as the 8-day J-map above, but shows only 4 days, centered on perihelion, and only includes distances to 25 R☉ to provide better resolution. See the caption above for more information. [Credit: NASA/JPL. Data processed by Paulo Penteado (JPL/Caltech).]
[ABOVE] This 4-day R-map uses the same data as the 4-day J-map (the data collected at each time/image along the PSP-Venus orbit plane), but makes the assumption that the (line-of-sight integrated) signal at each solar elongation all comes from where that line-of-sight hits the Thomson sphere, which is the location of maximum sensitivity of a white light telescope (see, e.g., Vourlidas & Howard, 2006, ApJ,642,1216; DOI: 10.1086/501122). This distance RT (the new y-axis) is related to the elongation by RT=RP*sin(elongation), where RP is PSP’s distance to the Sun. The R-map can be considered a “height-time” plot with and such maps can be used to estimate of the velocity of the observed transients. The LW composite movie above can be used to identify and find the cause of the various features seen in the R-map. Only data up to 90° has been included. [Credit: NASA/JPL. Data processed by Paulo Penteado (JPL/Caltech).]
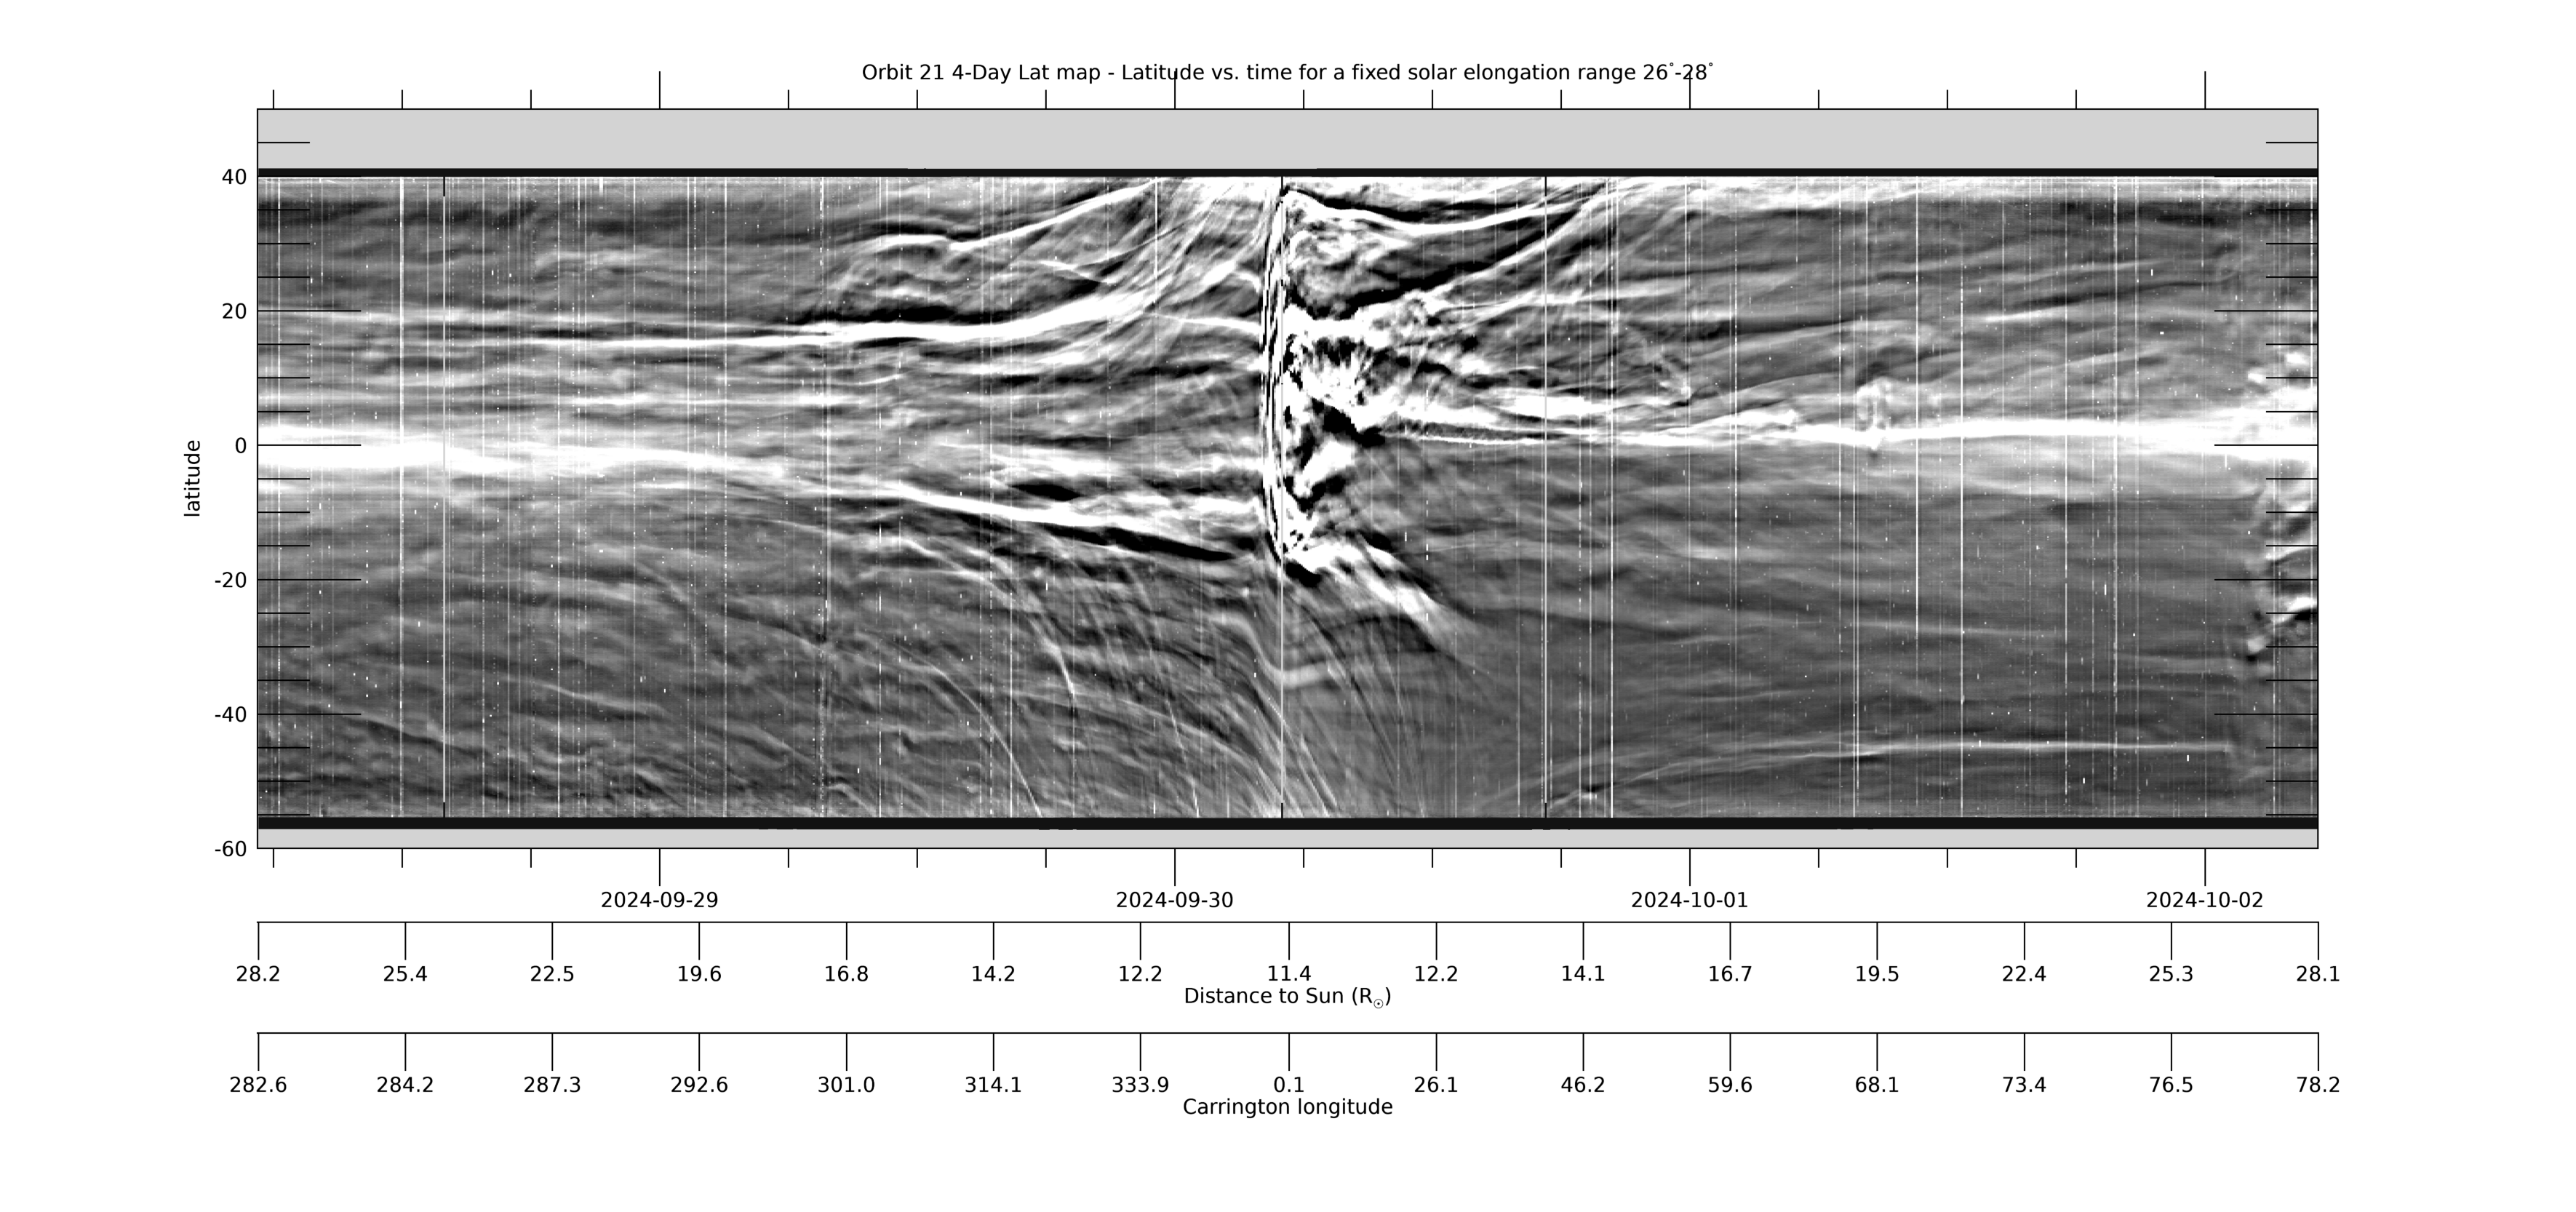
[ABOVE] This 4-day Lat-map shows the evolution in latitude, measured from the PSP-Venus orbit plane, for a fixed solar elongation of 26°-28°. The map is created from L3-processed images by collecting the arc of data in the WISPR-I FOV in the range 26°-28°elongation from each image and stacking the data horizontally in time (for details, see Liewer et al, 2023; DOI: 10.3847/1538-4357/acc8c7). Near perihelion when PSP is moving faster than the Sun rotates, quasi-stationary coronal rays may show large changes in apparent latitude as they approach and pass over or under the spacecraft. The map was created using L3 processed images. The L3 movies at this web site can be used to identify features seen in the Lat-map. [Credit: NASA/JPL. Data processed by Paulo Penteado (JPL/Caltech).]
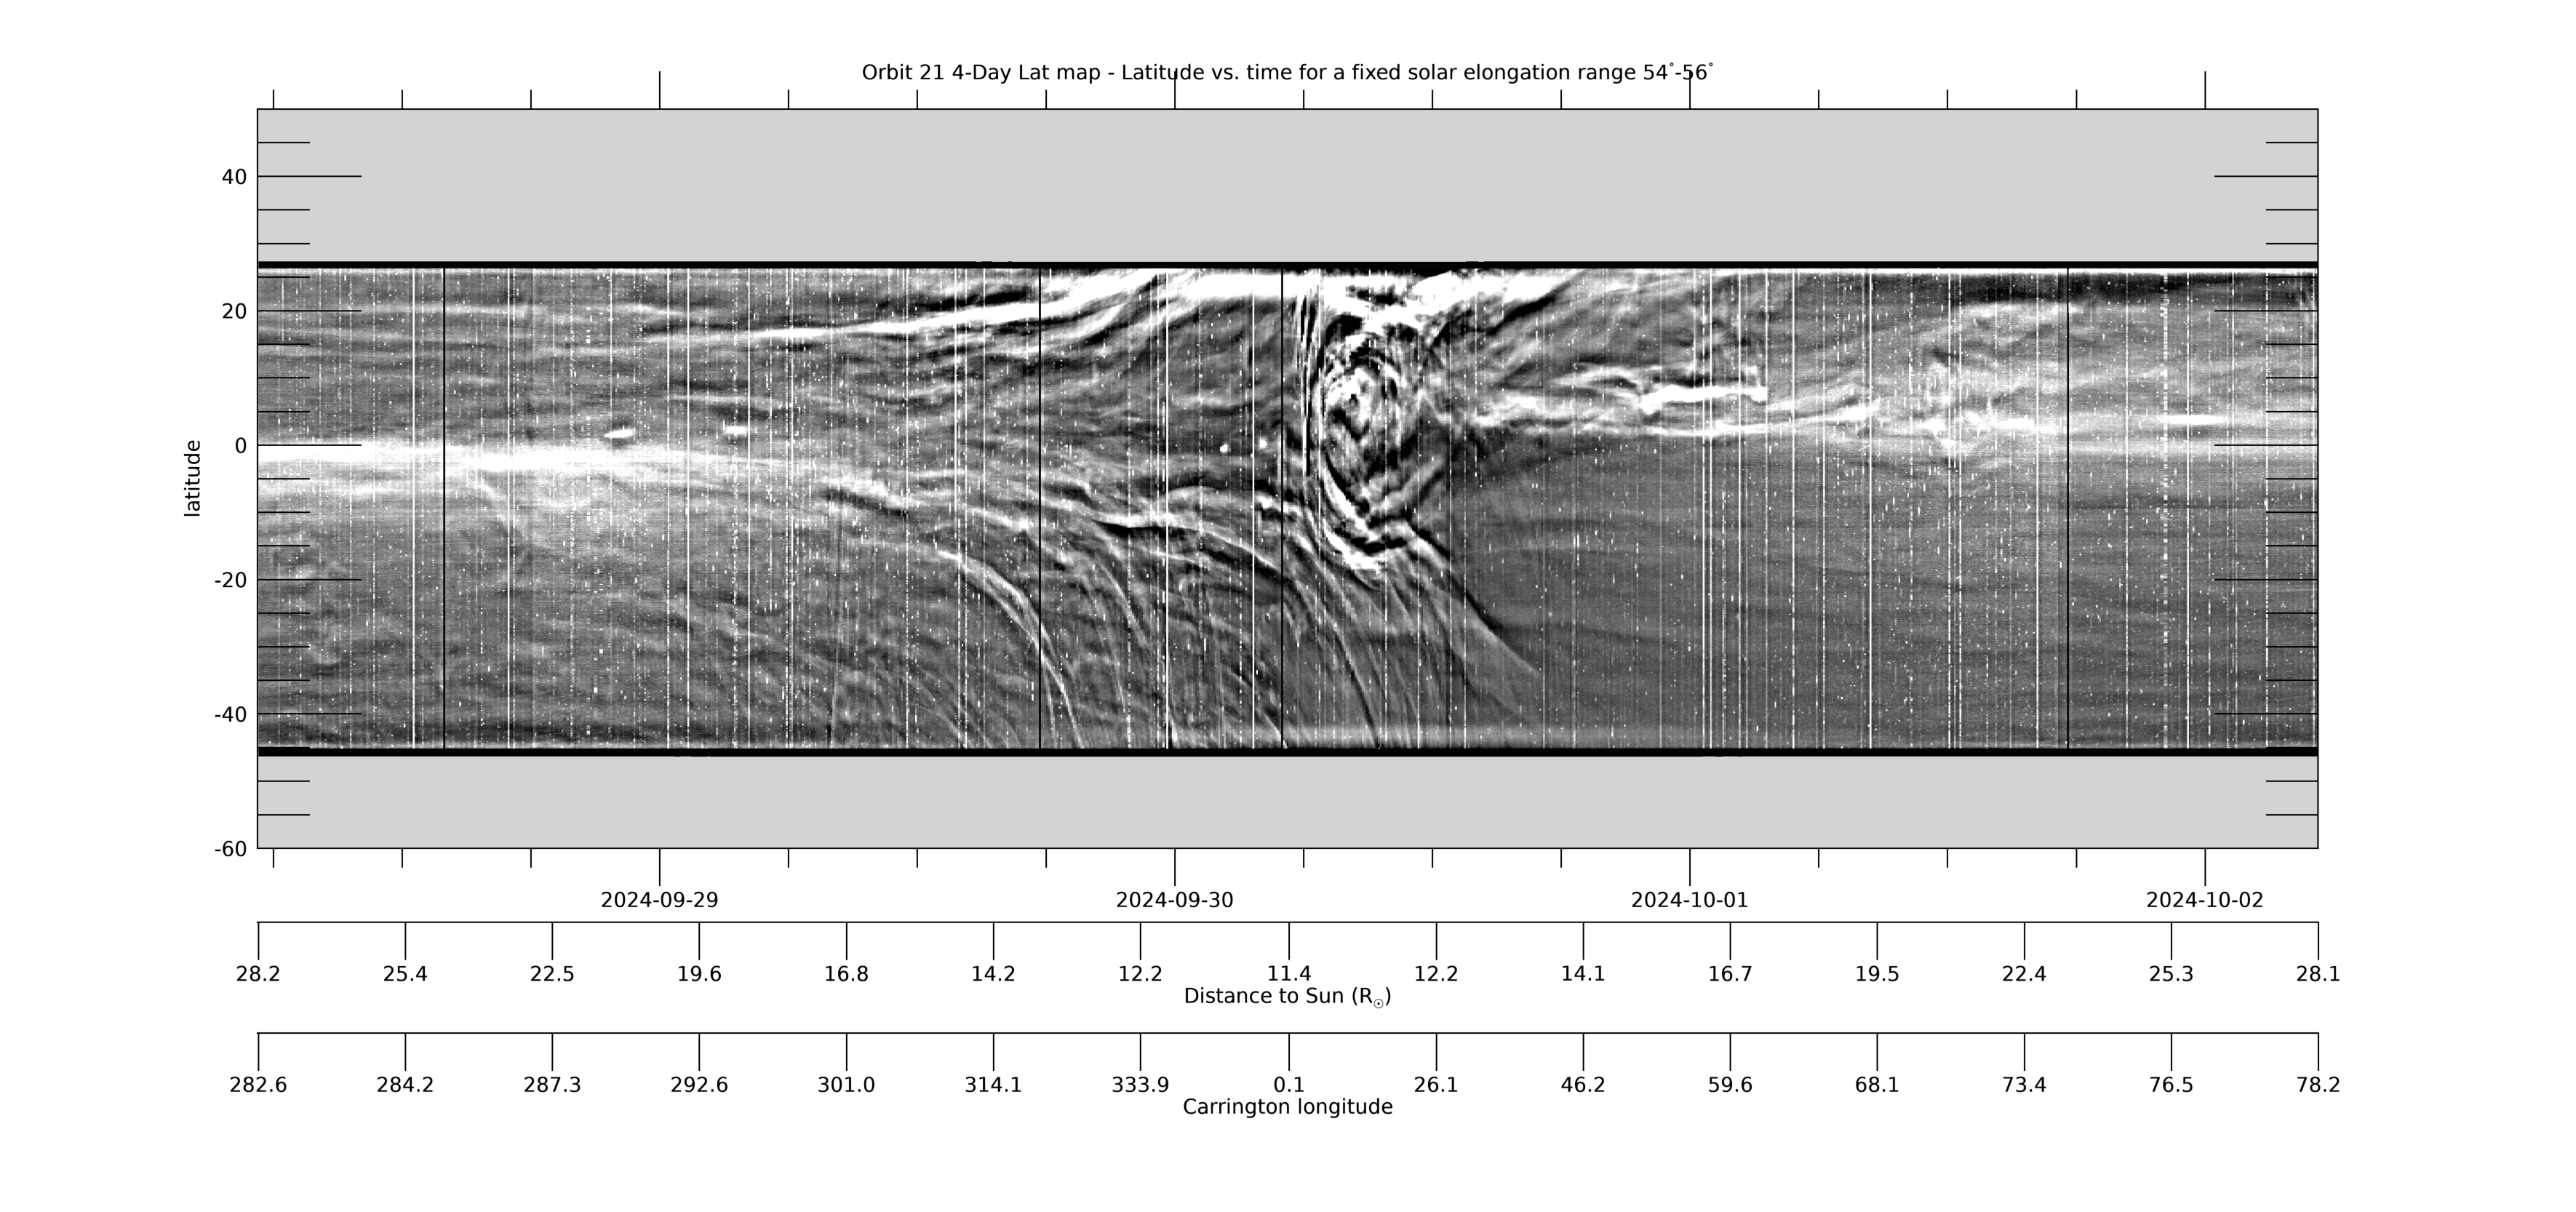
[ABOVE] This 4-day Lat-map shows the evolution in latitude, measured from the PSP-Venus orbit plane, by collecting the arc of data in the WISPR-O FOV for a fixed solar elongation range of 54°-56°. It is made in the same way as the WISPR-I Lat-map above. See that caption for more information. [Credit: NASA/JPL. Data processed by Paulo Penteado (JPL/Caltech).]
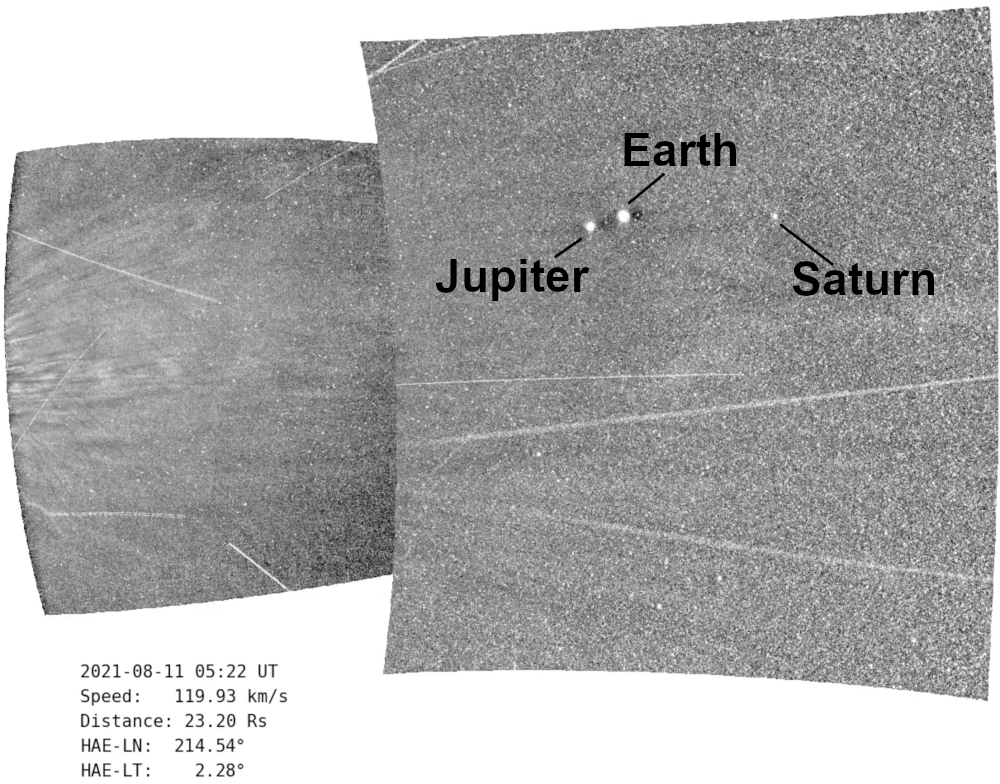
As announced this week by NASA, Parker Solar Probe officially "touched the Sun" as passed just 18.8 solar radii (approximately 8.1 million miles) above the solar surface. During this and every passage by the Sun that PSP has taken, NRL's WISPR camera has been observing the solar structures and outflows with its two wide-field white-light imaging instruments. The below animation shows the scene as viewed by WISPR for this ninth encounter, in which you can see vast solar structures passing over the spacecraft as it races through the Sun's outer atmosphere.
This animation shows all WISPR full-field observations from the ninth PSP Mission Encounter, 2021-August-08 to 2021-August-12. You can download this movie directly as a 79Mb mp4 file.
[Credit: NRL/NASA/JHUAPL. Movie processed/compiled by Guillermo Stenborg (JHUAPL) and Brendan Gallagher (NRL).]
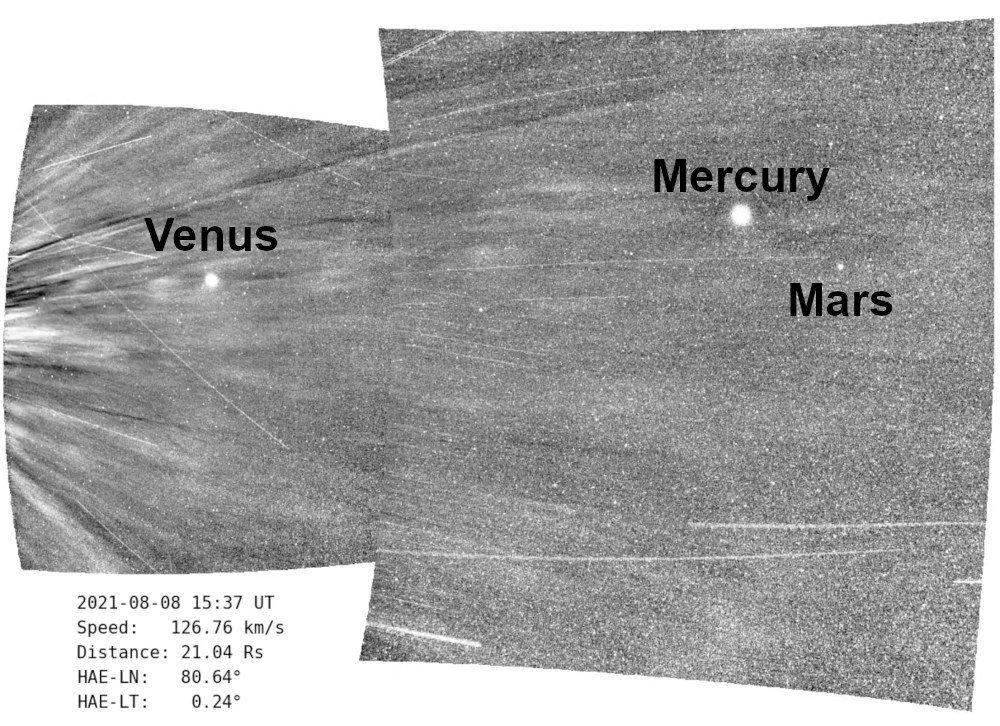
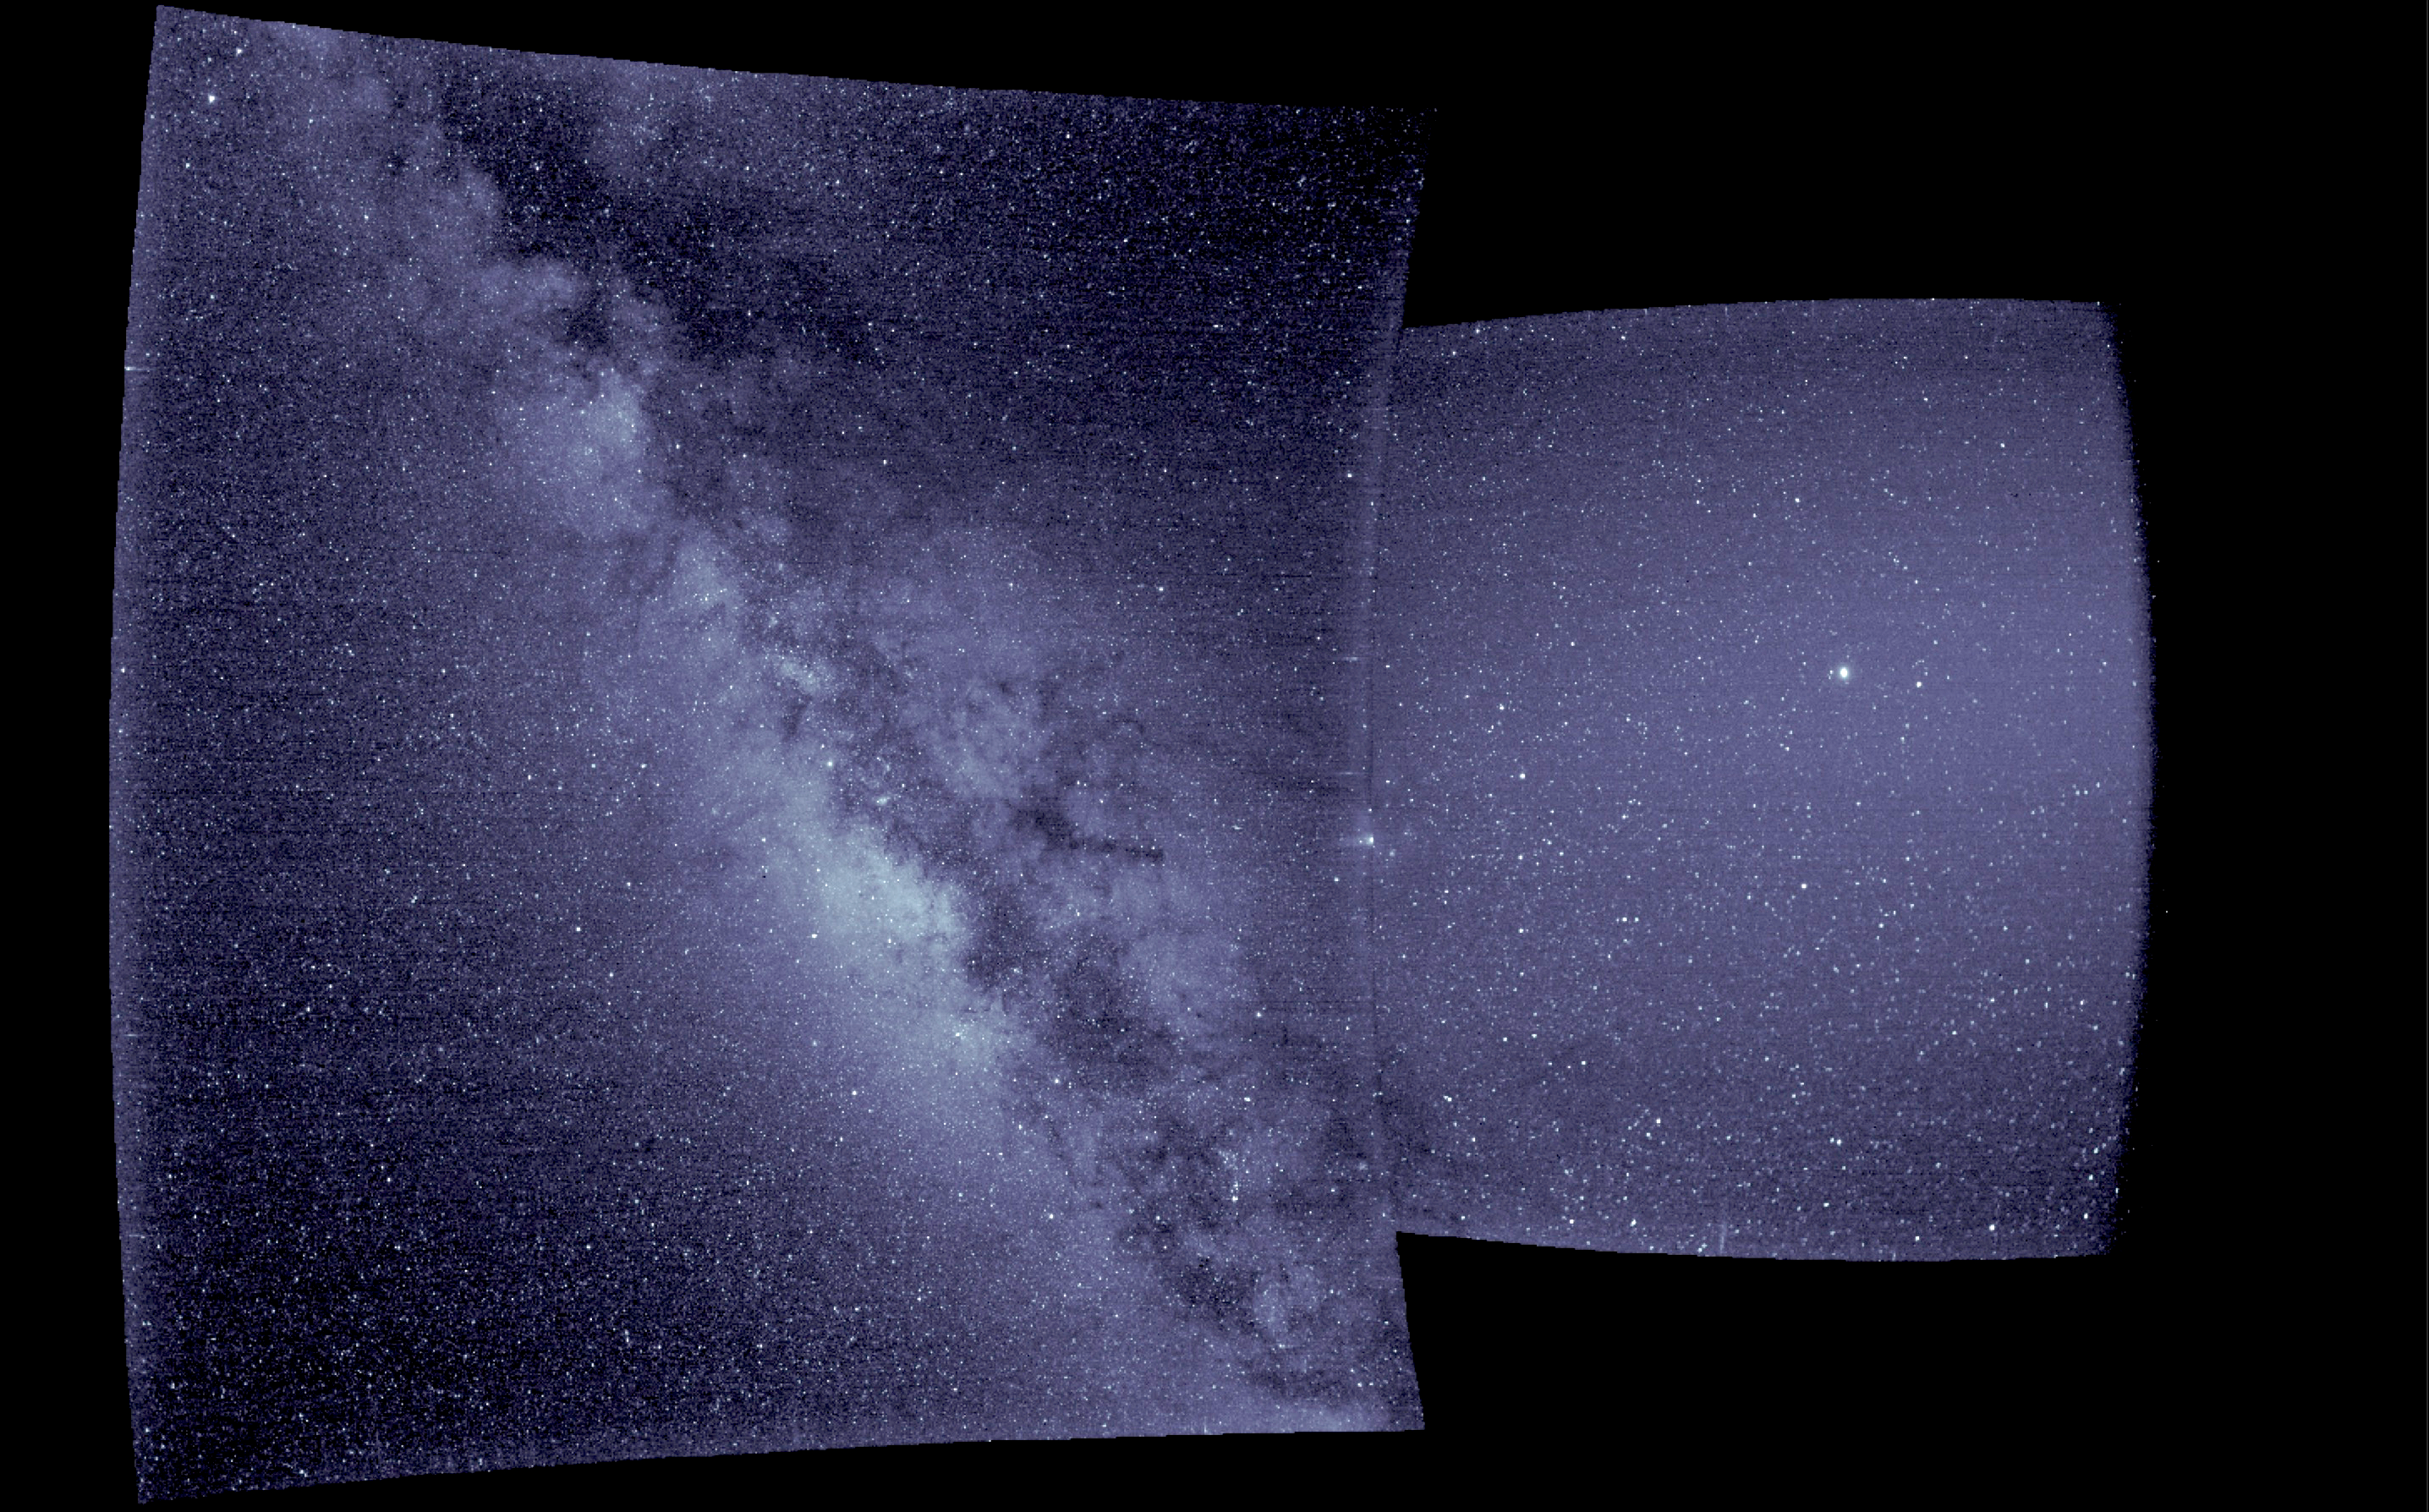
This movie shows a combination of the two WISPR camera fields of view. The data have been processed using a technique developed by Dr. Guillermo Stenborg that enhances the visibility of the structures, while minimizing excess stray light from dust and other sources. The telescopes are designed to keep the Sun outside of the field of view, to the left of the images, so that its blinding light does not overwhelm the detector. Throughout this sequence, an extensive background star field can be seen, with the Milky Way visible from August 09 - 10. Several planets are visible too, as shown in the below still frames. Towards the end of the sequence, Jupiter can be seen "overtaking" Earth in the field of view.
A large number of bright flashes and streaks are visible throughout this sequence. These are not cosmic rays (high-energy particles) but are actually dust particles resulting from PSP impacting micrometeorites as it races through the inner solar system.
N/A
Data for Encounter 8 is available (04-24-2021 - 05-04-2021, with limited additional data 04-14-2021 - 05-15-2021). All data can be obtained from the various links provided on our WISPR Data page.
Also, the team apologizes for the recent downtime of the WISPR website. At time of writing, the WISPR database query tool remains unavailable, but all data are easily obtained via the WISPR Data page. Also we will remind users that copies of our data archives can always be obtained via the Virtual Solar Observatory.
Encounter 7 (2021-01-11 - 2021-01-31, with limited additional data 2020-12-11 - 2021-02-19)
This animation shows all WISPR full-field observations from the seventh PSP Mission Encounter (01-11-2021 - 01-31-2021), using L3 observations. We have superimposed a grid showing helioprojective longitude and latitude, and a scale representation of the size and location of the Sun in the observations using the SDO/HMI Carrington map for this time period. The velocity and distance metrics displayed on the movies correspond respectively to the spacecraft's heliocentric velocity in kilometers per second, and its distance from the Sun's center in units of solar radii (where 1 solar radius = 695,700km). The "FOV Range" label provides the plane-of-sky distance limits of the inner and outermost edges of the fields of view, in units of solar radii. The horizontal blue line indicates the orbital plane of PSP. The timespan of this composite movie covers only the nominal science window when the spacecraft was within 0.25 au; a limited amount of data outside of this range may be available at the below links.
You can also download this movie directly as a 39MB mp4 file. It is also available in the same format processed via the LW Algorithm developed by Dr. Guillermo Stenborg (JHUAPL) and detailed in Appendix A of Howard et al. 2022 (ApJ, 936, id.43. DOI 10.3847/1538-4357/ac7ff5), and can be downloaded here as a 159MB mp4 file.
[Credit: NASA/NRL/JHUAPL. Movie processed/compiled by Guillermo Stenborg (JHUAPL) and Brendan Gallagher (NRL). SDO inset courtesy of NASA/SDO and the AIA, EVE, and HMI science teams.]
The following comets were observed during this encounter. Note that some of the data sets occur outside the nominal Encounter window and, in many cases, the spacecraft may have a non-standard roll orientation. Thus only limited observations would have been made for the comet in question. If you have trouble locating the comets in any of these data or questions regarding the proper treatment of the comet observation data, please contact the WISPR comet observation coordinator, Karl Battams - karl.battams[at]nrl.navy.mil.
Jan 5, 2021 (inner detector): Kreutz-group sungrazer "SOHO-4117".
[Animation credit: Alan Watson]
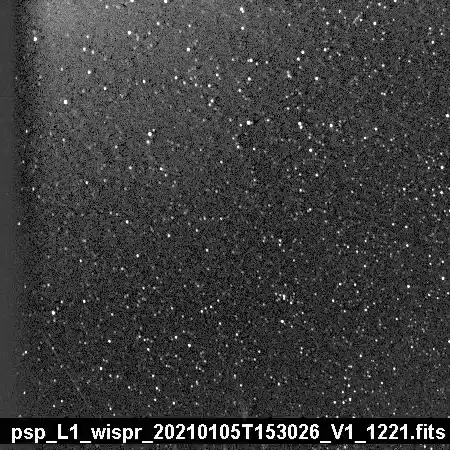
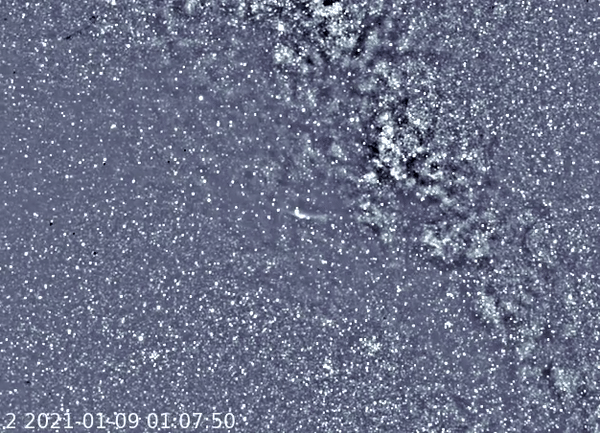
Jan 9-11, 2021 (outer detector): C/2020 S3 (Erasmus), ~0.81 AU from spacecraft, ~0.79 AU from Sun.
[Credit(s): PSP/WISPR/NASA/JHUAPL/NRL/Brendan Gallagher]
The following planets can be seen in the nominal encounter sequence movie (top of page), moving from left to right:
Earth: Jan 12-13, 2021 (Outer)
Venus: Jan 16-17, 2021 (Inner), Jan 17-18, 2021 (Outer)
Saturn: Jan 17-18, 2021 (Inner), Jan 18-20, 2021 (Outer)
Jupiter: Jan 17-18, 2021 (Inner), Jan 18-20, 2021 (Outer) - to the left of Saturn
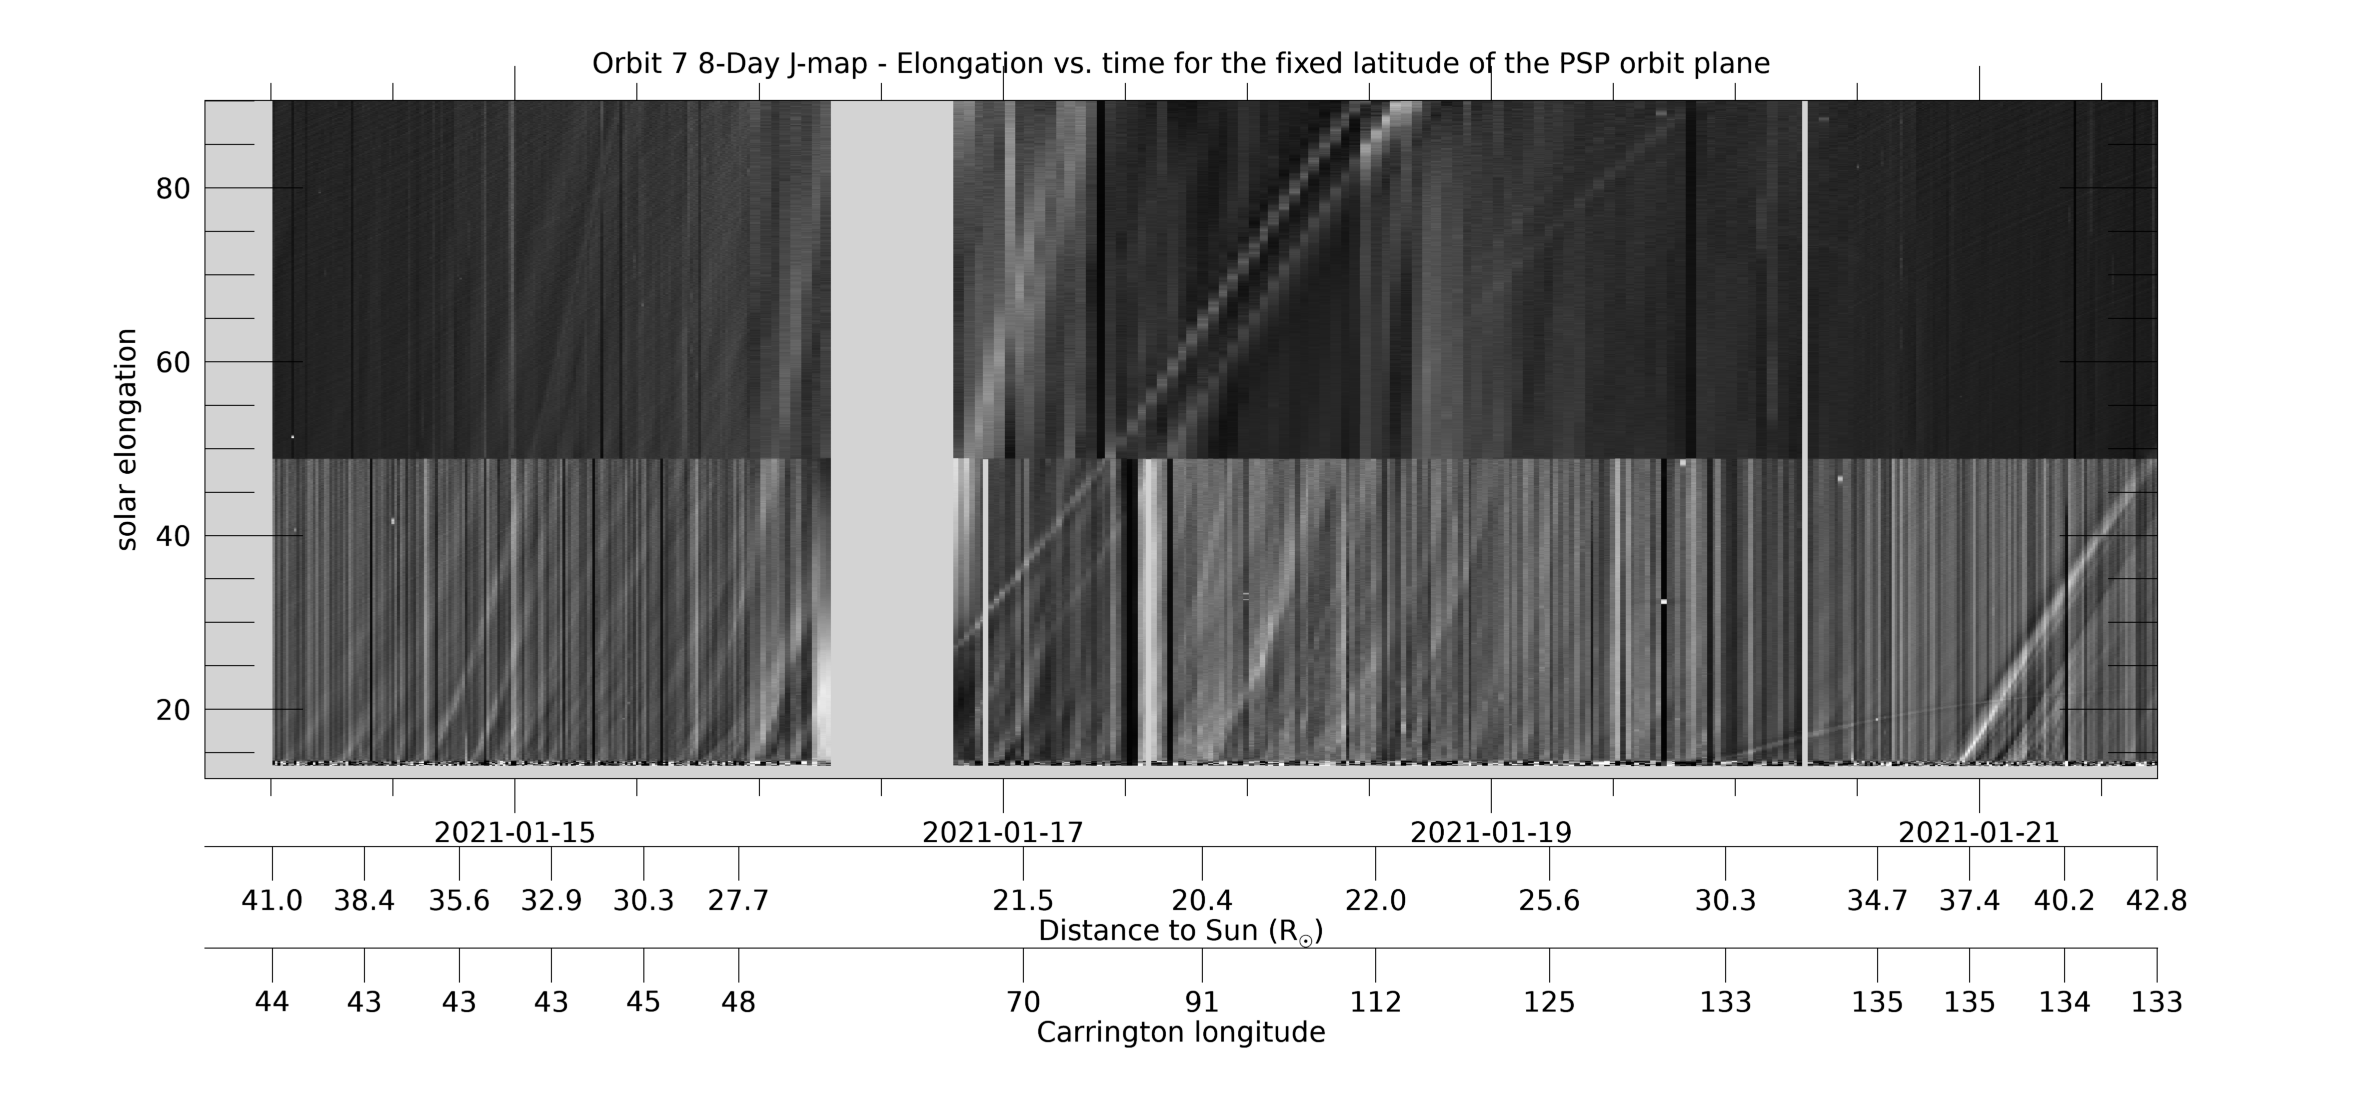
[ABOVE] This 8-day WISPR J-map shows solar elongation (angle from the Sun center) versus time at a fixed latitude measured relative to the PSP-Venus orbit plane. It is created from composite LW-processed full field-of-view (FOV) composite images such as those in the LW movie above, in which the PSP-Venus orbit plane is marked with a blue line. For each image (each time), data is collected along the PSP-Venus orbit plane for the full range of elongations in the WISPR FOV. The collected data is then stacked in time (x-axis) with elongation as the y-axis. The WISPR movies at this web site can be used to identify and find the cause of the various features seen in the J-map. Below the time axis are two additional axes showing PSP’s distance to the Sun RP and its Carrington longitude at that time. The time span in this and subsequent maps is centered on the time of perihelion. [Credit: NASA/JPL. Data processed by Paulo Penteado (JPL/Caltech).]
[ABOVE] This 4-day WISPR J-map uses the same data as the 8-day J-map above, but shows only 4 days, centered on perihelion, and only includes distances to 25 R☉ to provide better resolution. See the caption above for more information. [Credit: NASA/JPL. Data processed by Paulo Penteado (JPL/Caltech).]
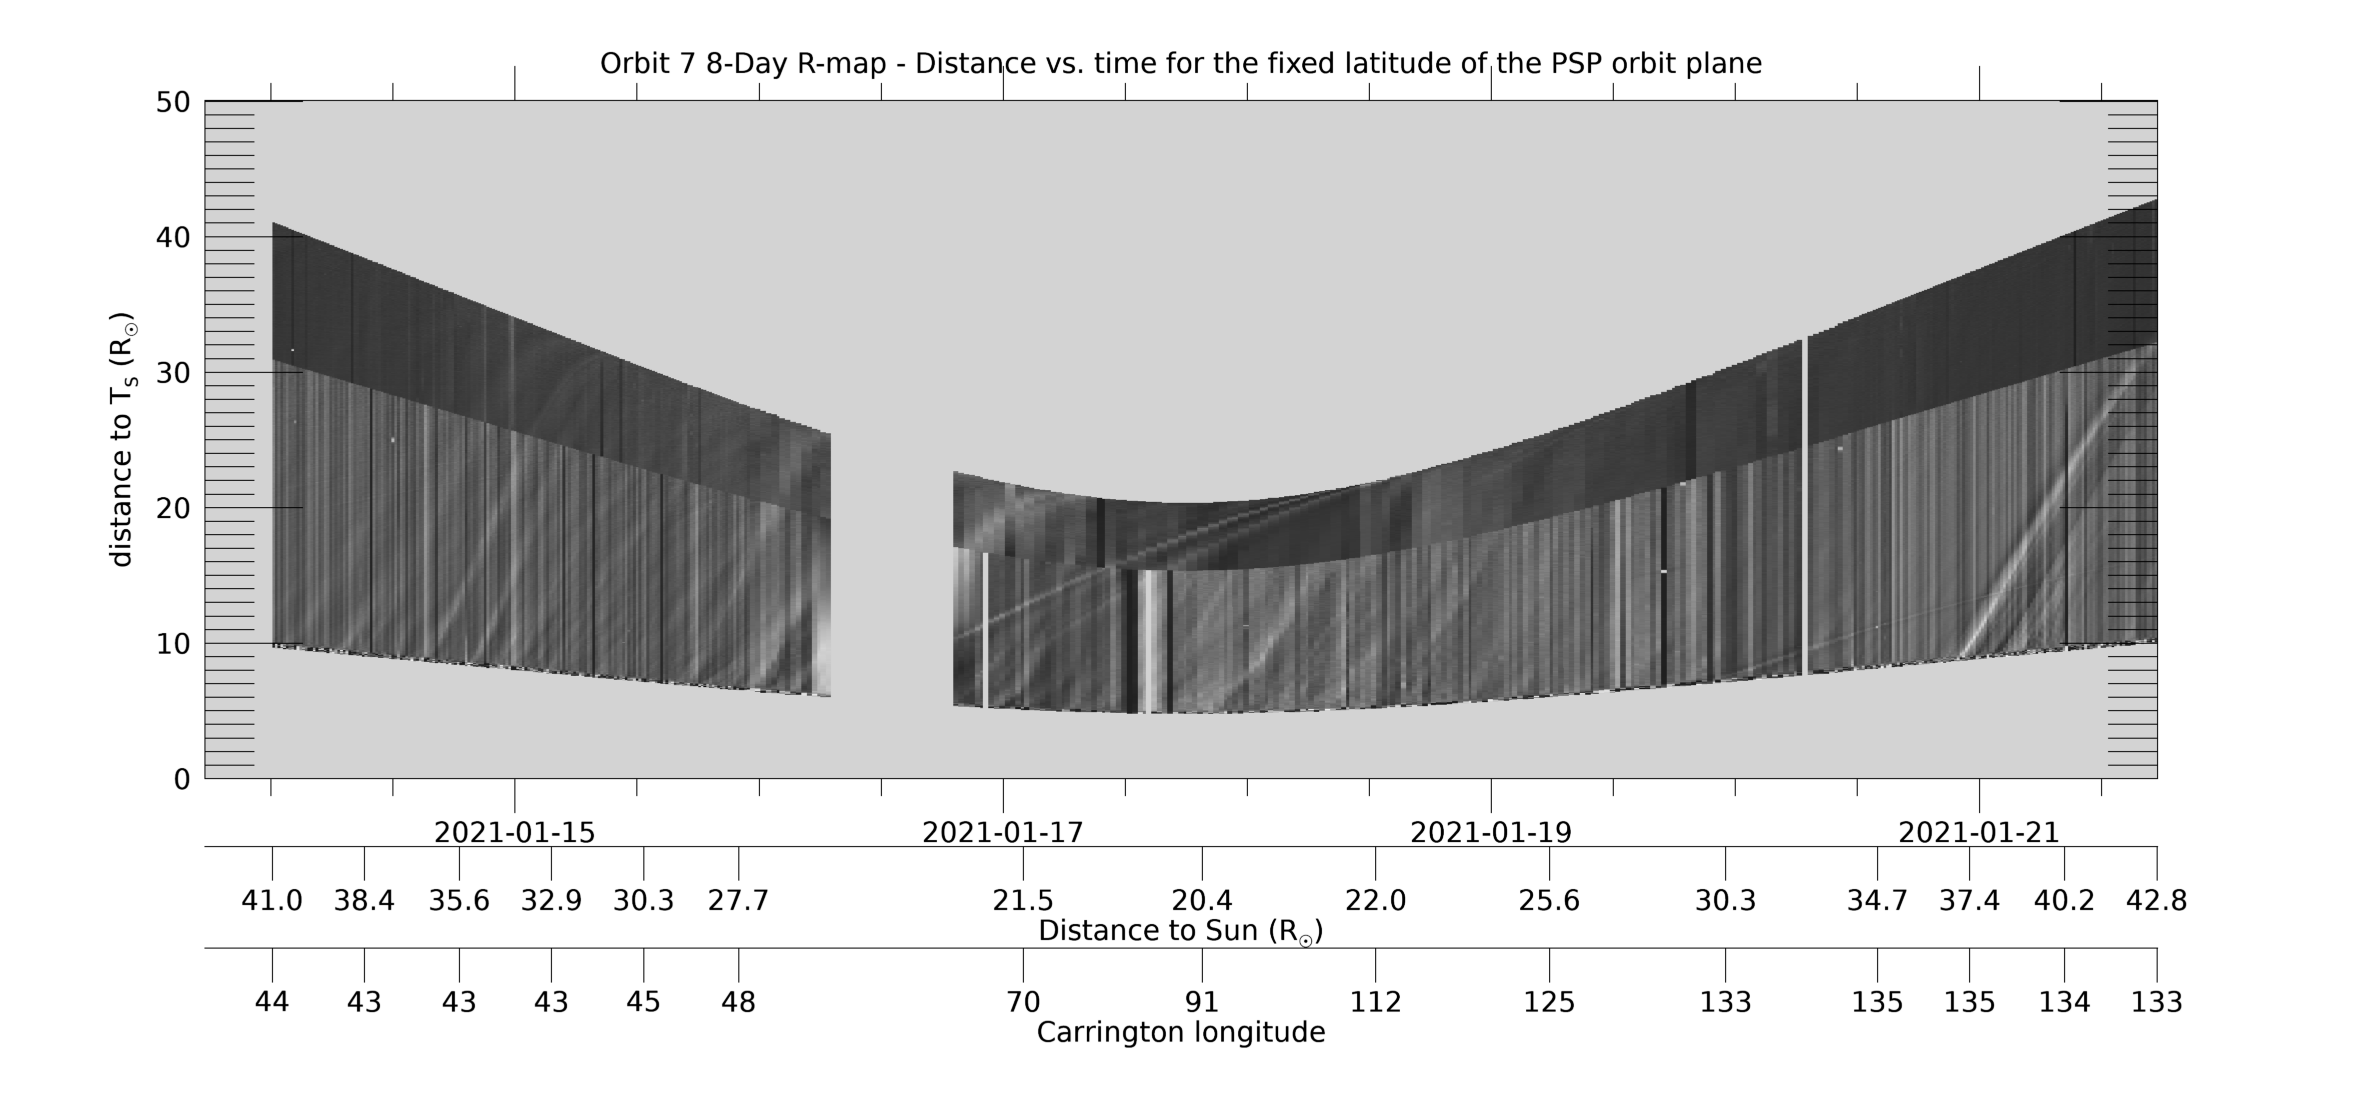
[ABOVE] This 8-day R-map uses the same data as the 8-day J-map (the data collected at each time/image along the PSP-Venus orbit plane), but makes the assumption that the (line-of-sight integrated) signal at each solar elongation all comes from where that line-of-sight hits the Thomson sphere, which is the location of maximum sensitivity of a white light telescope (see, e.g., Vourlidas & Howard, 2006, ApJ,642,1216; DOI: 10.1086/501122). This distance RT (the new y-axis) is related to the elongation by RT=RP*sin(elongation), where RP is PSP’s distance to the Sun. The R-map can be considered a “height-time” plot with and such maps can be used to estimate of the velocity of the observed transients. The LW composite movie above can be used to identify and find the cause of the various features seen in the R-map. Only data up to 90° has been included. [Credit: NASA/JPL. Data processed by Paulo Penteado (JPL/Caltech).]
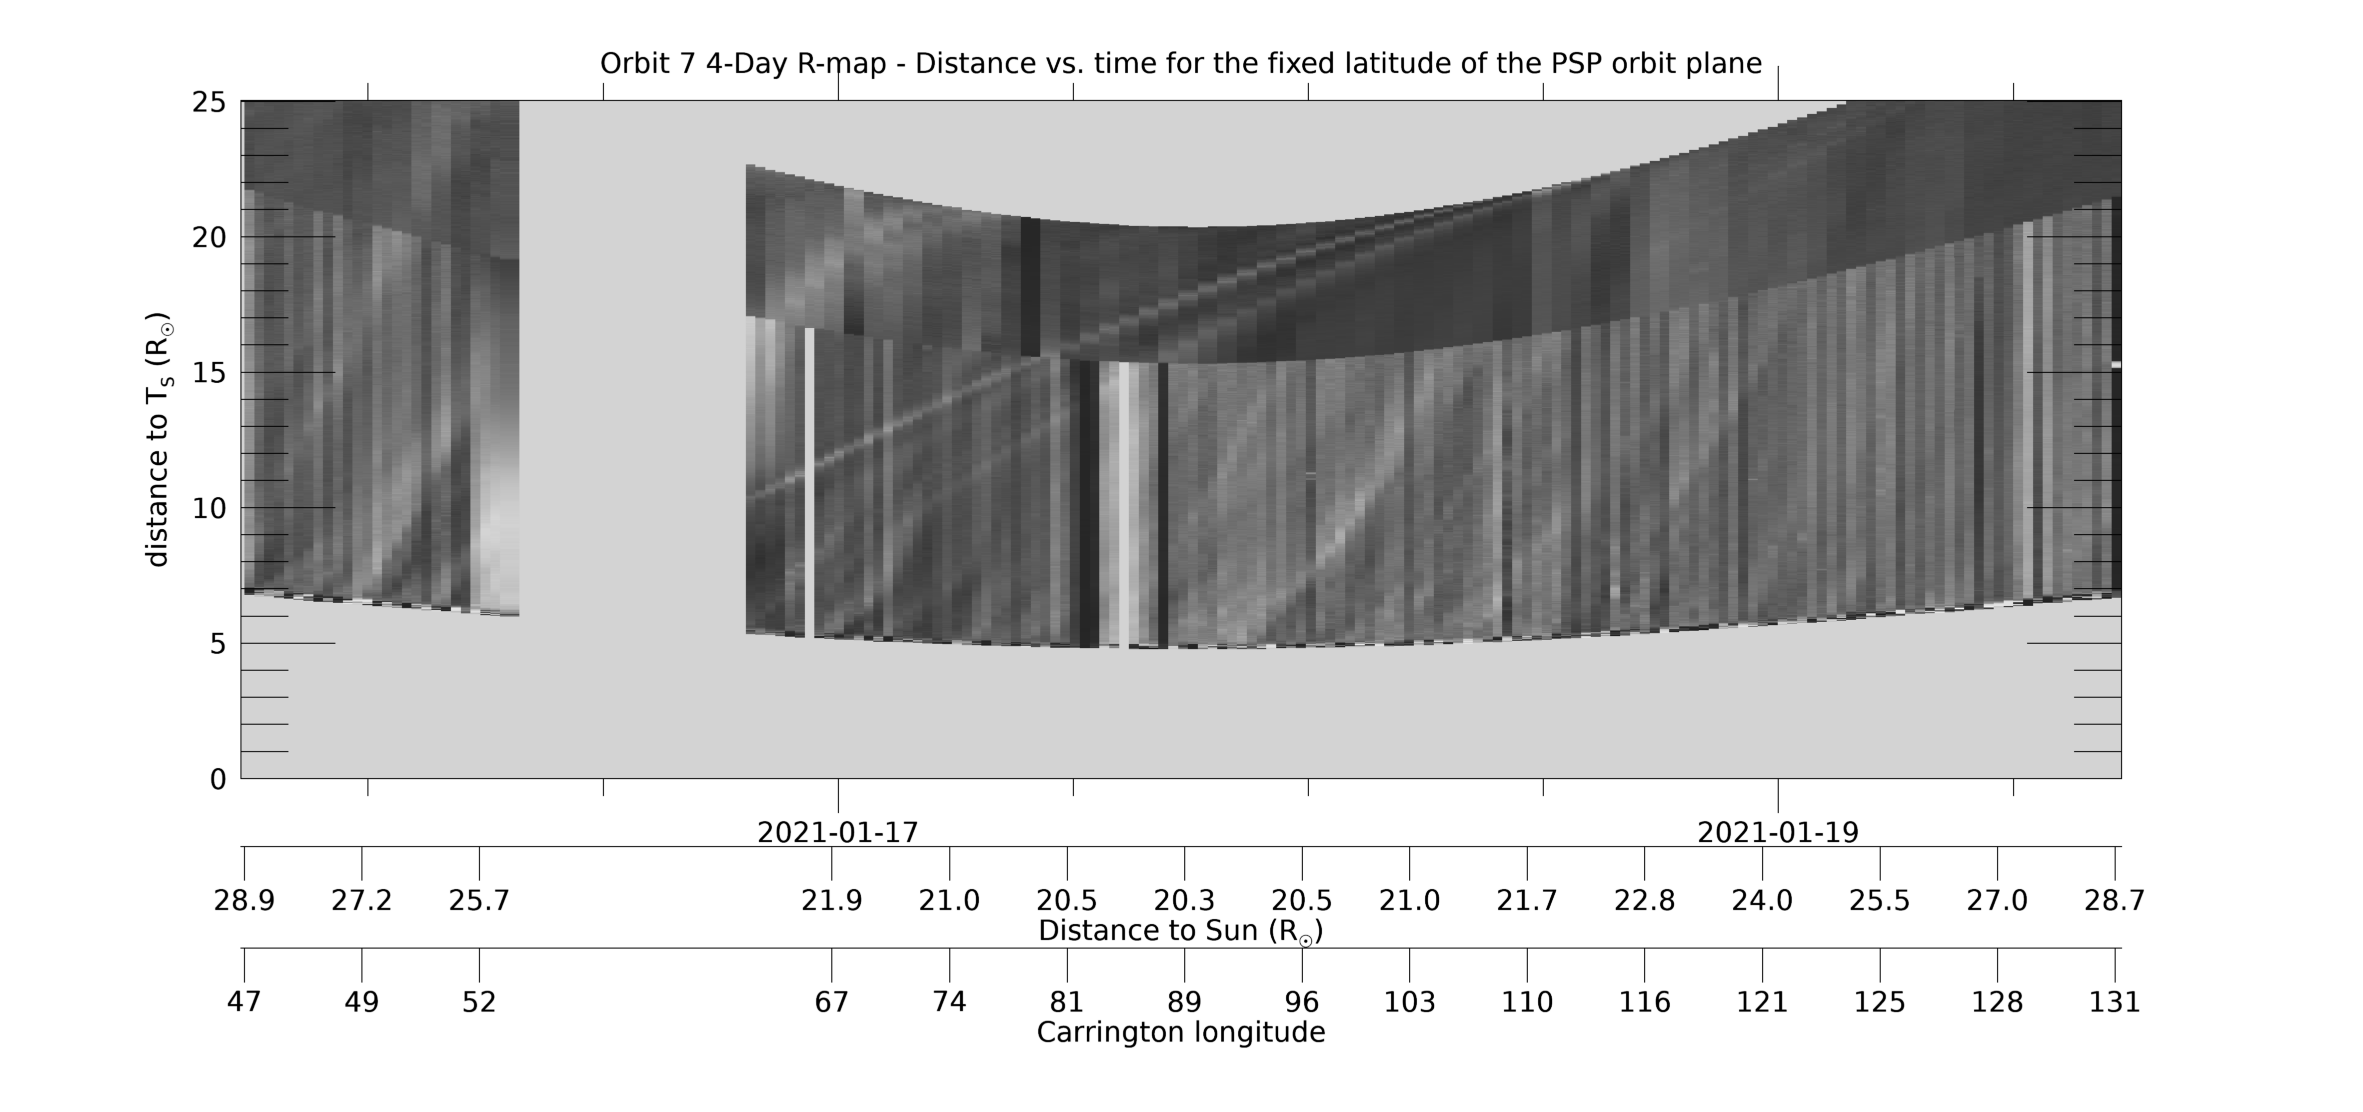
[ABOVE] This 4-day WISPR R-map shows the same data as the 8-day R-map above, but for only 4 days, centered on perihelion, to provide better resolution. See the caption for the 8-day R-map for more information.[Credit: NASA/JPL. Data processed by Paulo Penteado (JPL/Caltech).].
[ABOVE] This 4-day Lat-map shows the evolution in latitude, measured from the PSP-Venus orbit plane, for a fixed solar elongation of 26°-28°. The map is created from L3-processed images by collecting the arc of data in the WISPR-I FOV in the range 26°-28°elongation from each image and stacking the data horizontally in time (for details, see Liewer et al, 2023; DOI: 10.3847/1538-4357/acc8c7). Near perihelion when PSP is moving faster than the Sun rotates, quasi-stationary coronal rays may show large changes in apparent latitude as they approach and pass over or under the spacecraft. The map was created using L3 processed images. The L3 movies at this web site can be used to identify features seen in the Lat-map. [Credit: NASA/JPL. Data processed by Paulo Penteado (JPL/Caltech).]
[ABOVE] This 4-day Lat-map shows the evolution in latitude, measured from the PSP-Venus orbit plane, by collecting the arc of data in the WISPR-O FOV for a fixed solar elongation range of 54°-56°. It is made in the same way as the WISPR-I Lat-map above. See that caption for more information. [Credit: NASA/JPL. Data processed by Paulo Penteado (JPL/Caltech).]
On November 12, 2019, data recorded by our Wide-field Imager for Parker Solar Probe (WISPR) imaging instrument aboard the NASA Parker Solar Probe (PSP) mission became publicly releasable! That means you can now download all the WISPR data from PSP's first two 'encounters' over on our data retrieval page, where we provide links to the science data (FITS format), and browse images in PNG and MPG format (as seen below). Moving forward, the data from future encounters will be made available within 90 days of receipt of all telemetry for that encounter with the next data set (Encounter 3) anticipated to be released in early 2020.
To celebrate the release of the WISPR data, below are two movies from each of the first two PSP encounters. The movies show the combined fields of view of the inner and outer WISPR telescopes.
In these movies, the Sun is outside of the left-hand edge of the field of view (at 0-degrees longitude on the x-axis scale shown). In addition to the Milky Way and many stars, several planets can be seen crossing the WISPR fields of view.
Encounter 1, Nov 01 - 11, 2018
This animation shows all WISPR full-field observations from the first PSP Mission Encounter (Nov 01 - 11, 2018). We have superimposed a grid showing heliocentric longitude and latitude.
Use the following links to download this movie:
[Credit: NRL/NASA. Movie processed/compiled by Guillermo Stenborg and Brendan Gallagher (NRL).]
Encounter 2, Apr 01 - 10, 2019
This animation shows all WISPR full-field observations from the second PSP Mission Encounter (April 01 - 10, 2019). We have superimposed a grid showing heliocentric longitude and latitude.
Use the following links to download this movie:
[Credit: NRL/NASA. Movie processed/compiled by Guillermo Stenborg and Brendan Gallagher (NRL).]
NASA Press Release
On September 9th, 2018, the door on the NRL WISPR instrument was opened successfully and we obtained our very first images with both the inner and outer cameras.
First Light Image from NRL's WISPR instrument on NASA Parker Solar Probe, September 9th, 2018.
At the time images were taken, the spacecraft was rolled such that we were not observing any coronal structure. We did, however, get a beautiful view of the Milky Way! The exposure time for these first images was intentionally low for the first observations, but will be modified accordingly once coronal structures appear in the fields of view. More information about the upcoming plans for Parker Solar Probe and its instrumentation can be found here.

