Encounter 24 (2025-06-09 - 2025-06-30, with limited additional data 2025-06-06 - 2025-07-02)
This animation shows all L3 WISPR full-field observations from the twenty-second PSP Mission Encounter (2025-03-18 - 2025-03-27). We have superimposed a grid showing helioprojective longitude and latitude, and a scale representation of the size and location of the Sun in the observations using the SDO/HMI Carrington map for this time period. The velocity and distance metrics displayed on the movies correspond respectively to the spacecraft's heliocentric velocity in kilometers per second, and its distance from the Sun's center in units of solar radii (where 1 solar radius = 695,700km). The "FOV Range" label provides the plane-of-sky distance limits of the inner and outermost edges of the fields of view, in units of solar radii. The horizontal blue line indicates the orbital plane of PSP. The timespan of this composite movie covers only the nominal science window when the spacecraft was within 0.25 au; a limited amount of data outside of this range may be available at the below links.
You can download this movie directly as an 105MB mp4 file. This sequence is also available as data processed via the LW Algorithm developed by Dr. Guillermo Stenborg (JHUAPL) and detailed in Appendix A of Howard et al. 2022 (ApJ, 936, id.43. DOI 10.3847/1538-4357/ac7ff5). Please contact the team for access to this data, which will be posted here one year after the acquisition of those observations. Team contact information can be found in Section 1.2 of the WISPR User's Guide [PDF link].
[Credit: NASA/NRL/JHUAPL. Movie processed/compiled by Guillermo Stenborg (JHUAPL) and Karl Battams (NRL). SDO inset courtesy of NASA/SDO and the AIA, EVE, and HMI science teams.]
Solar Features
TBD
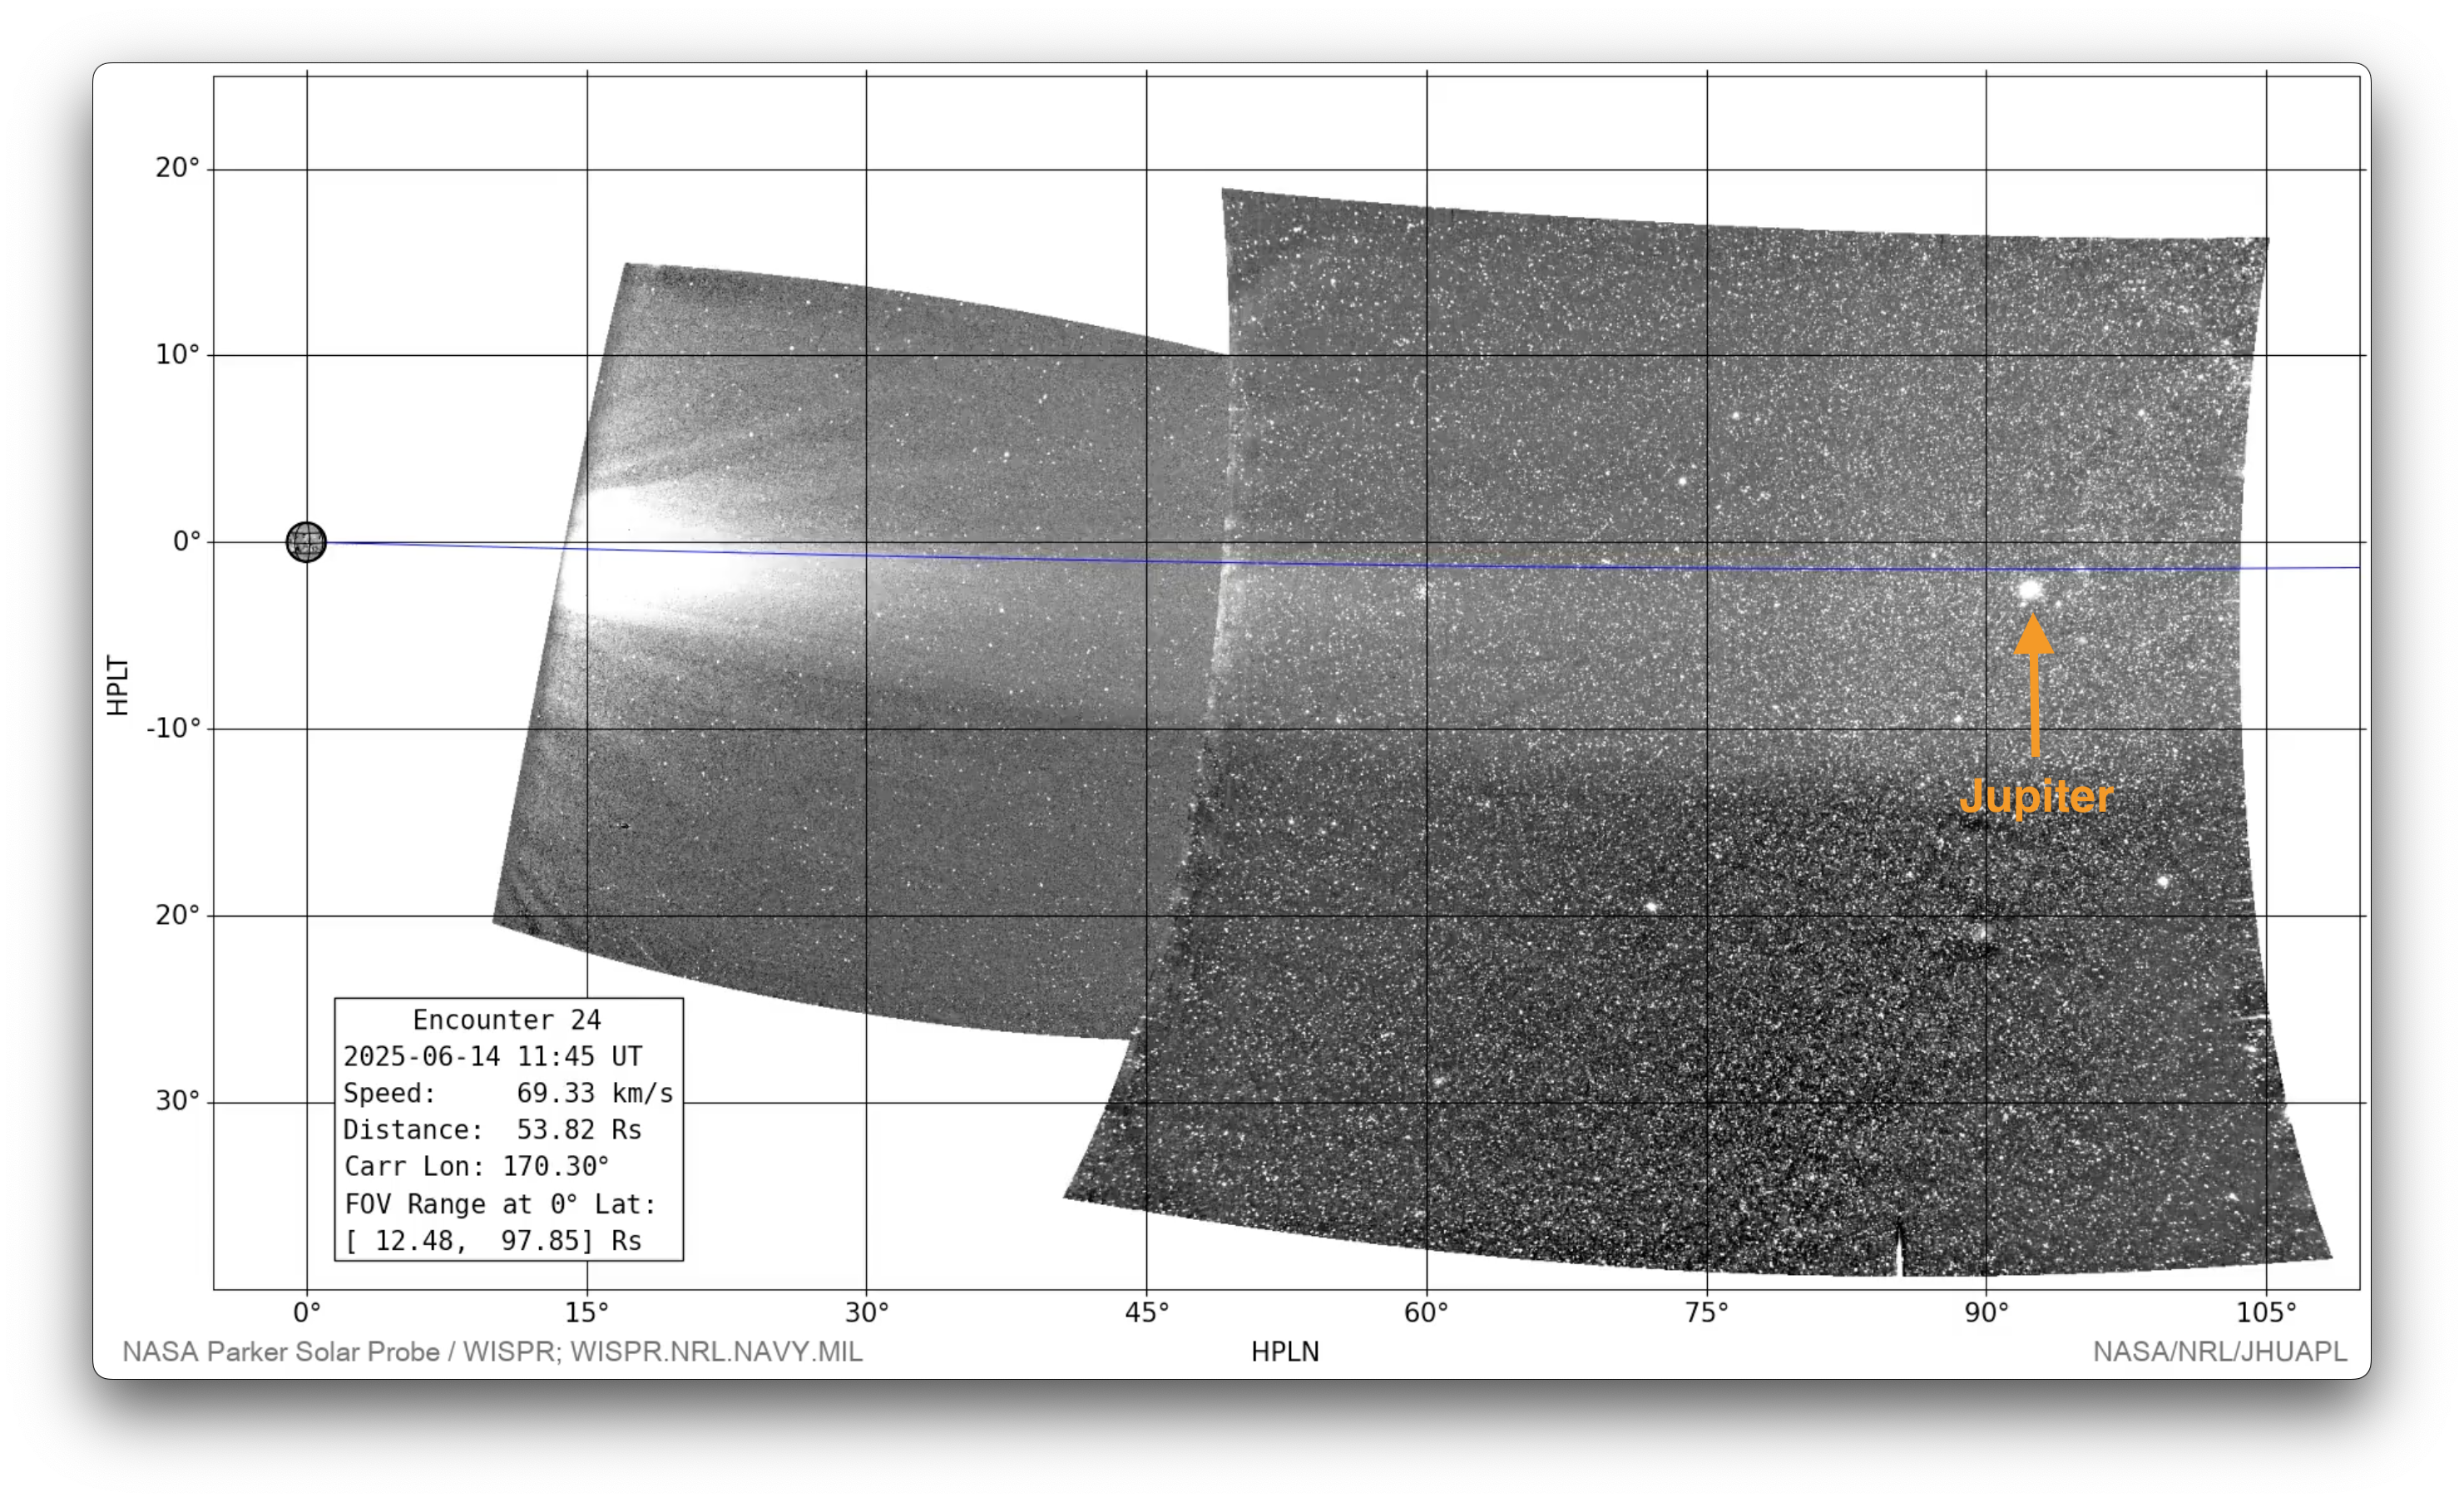
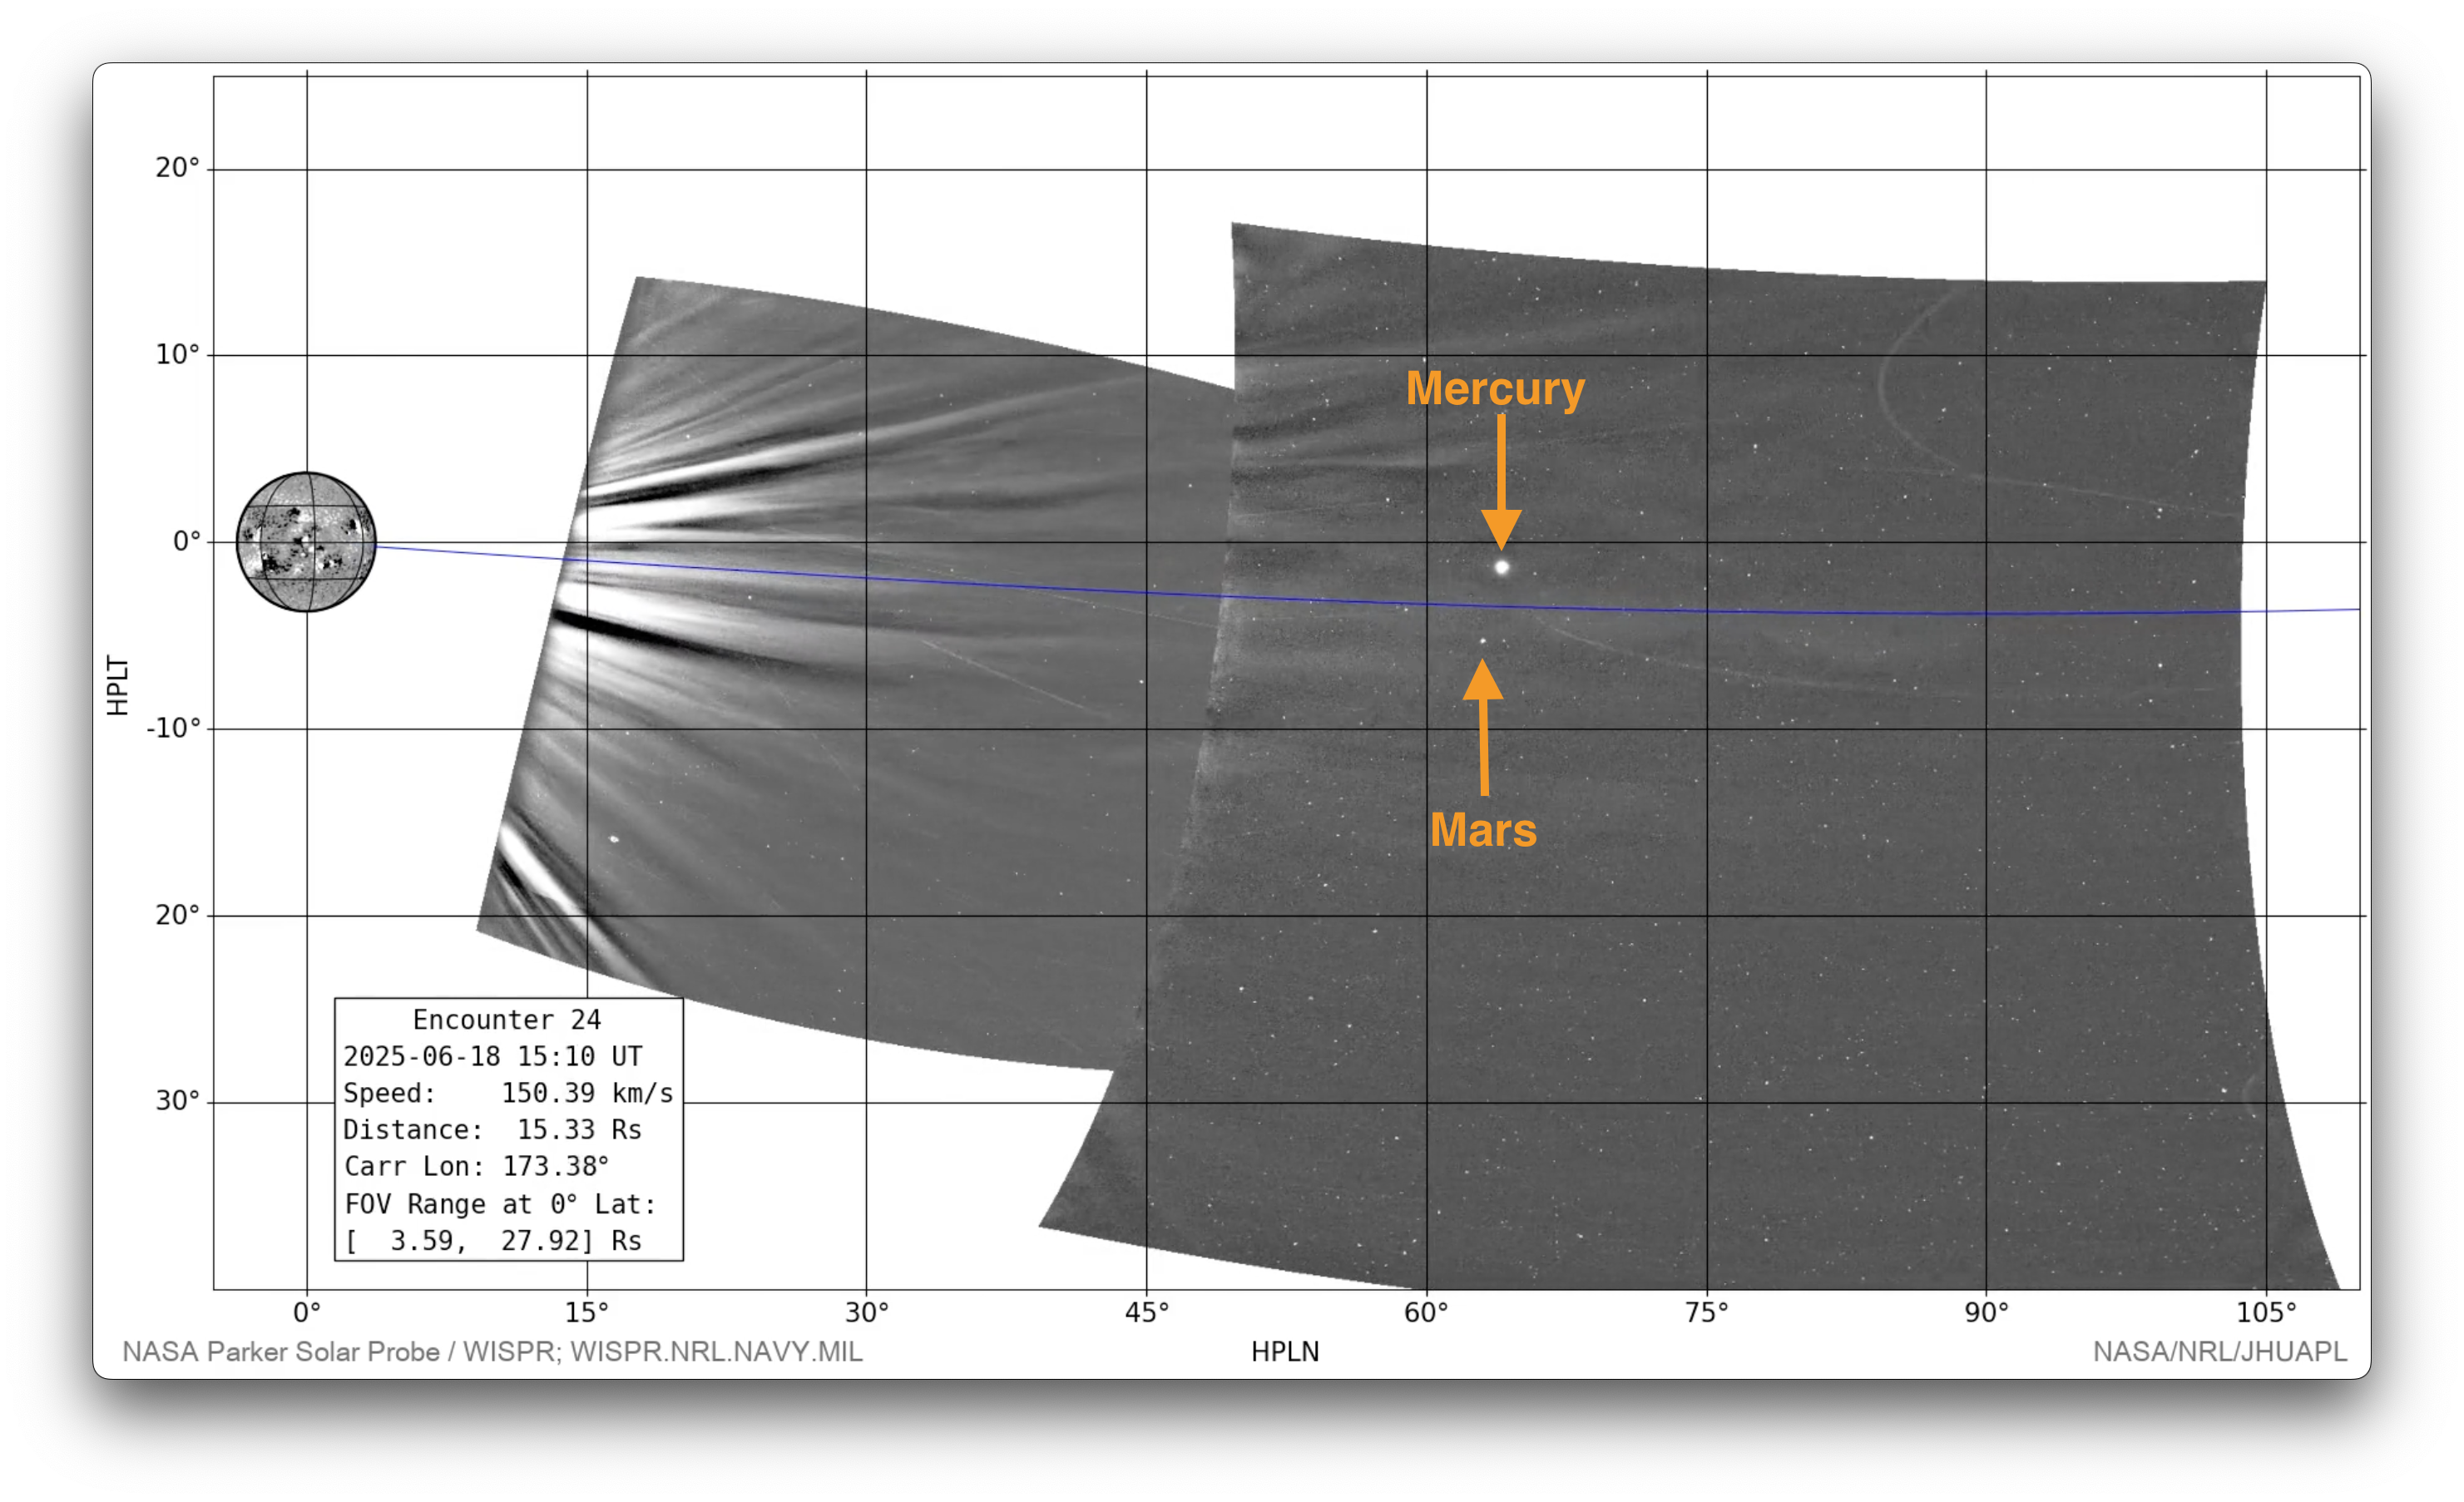
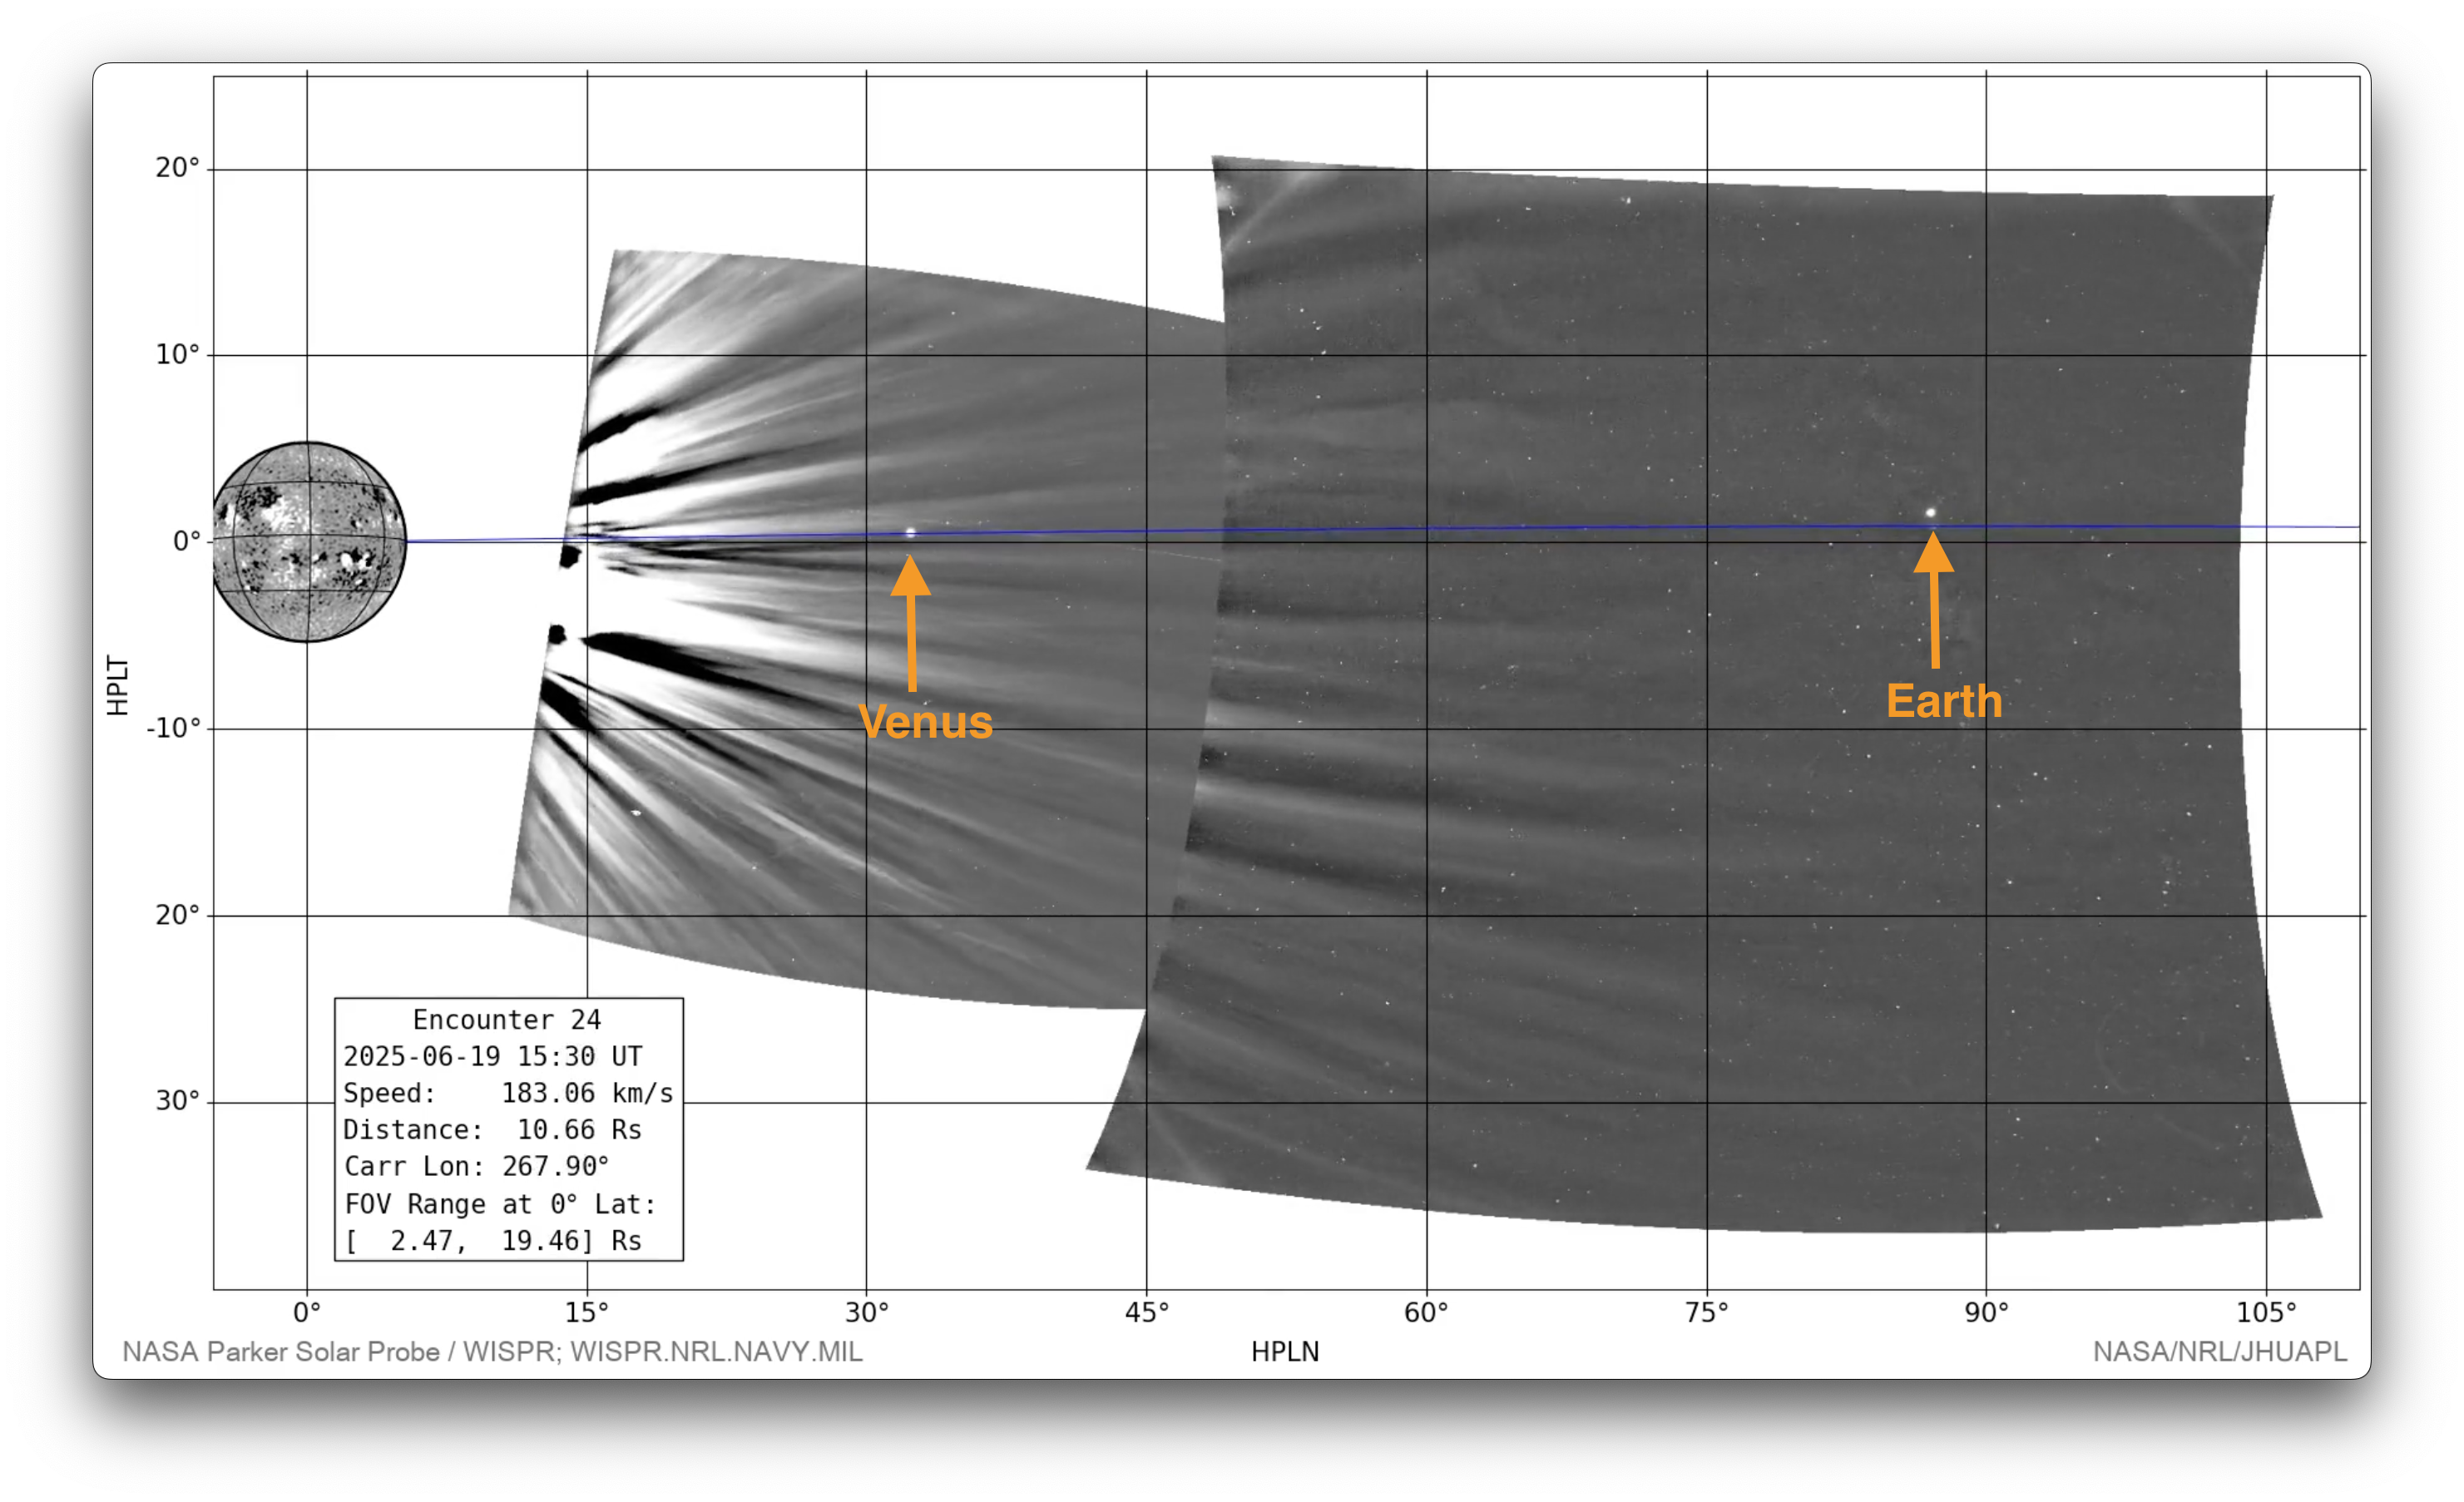
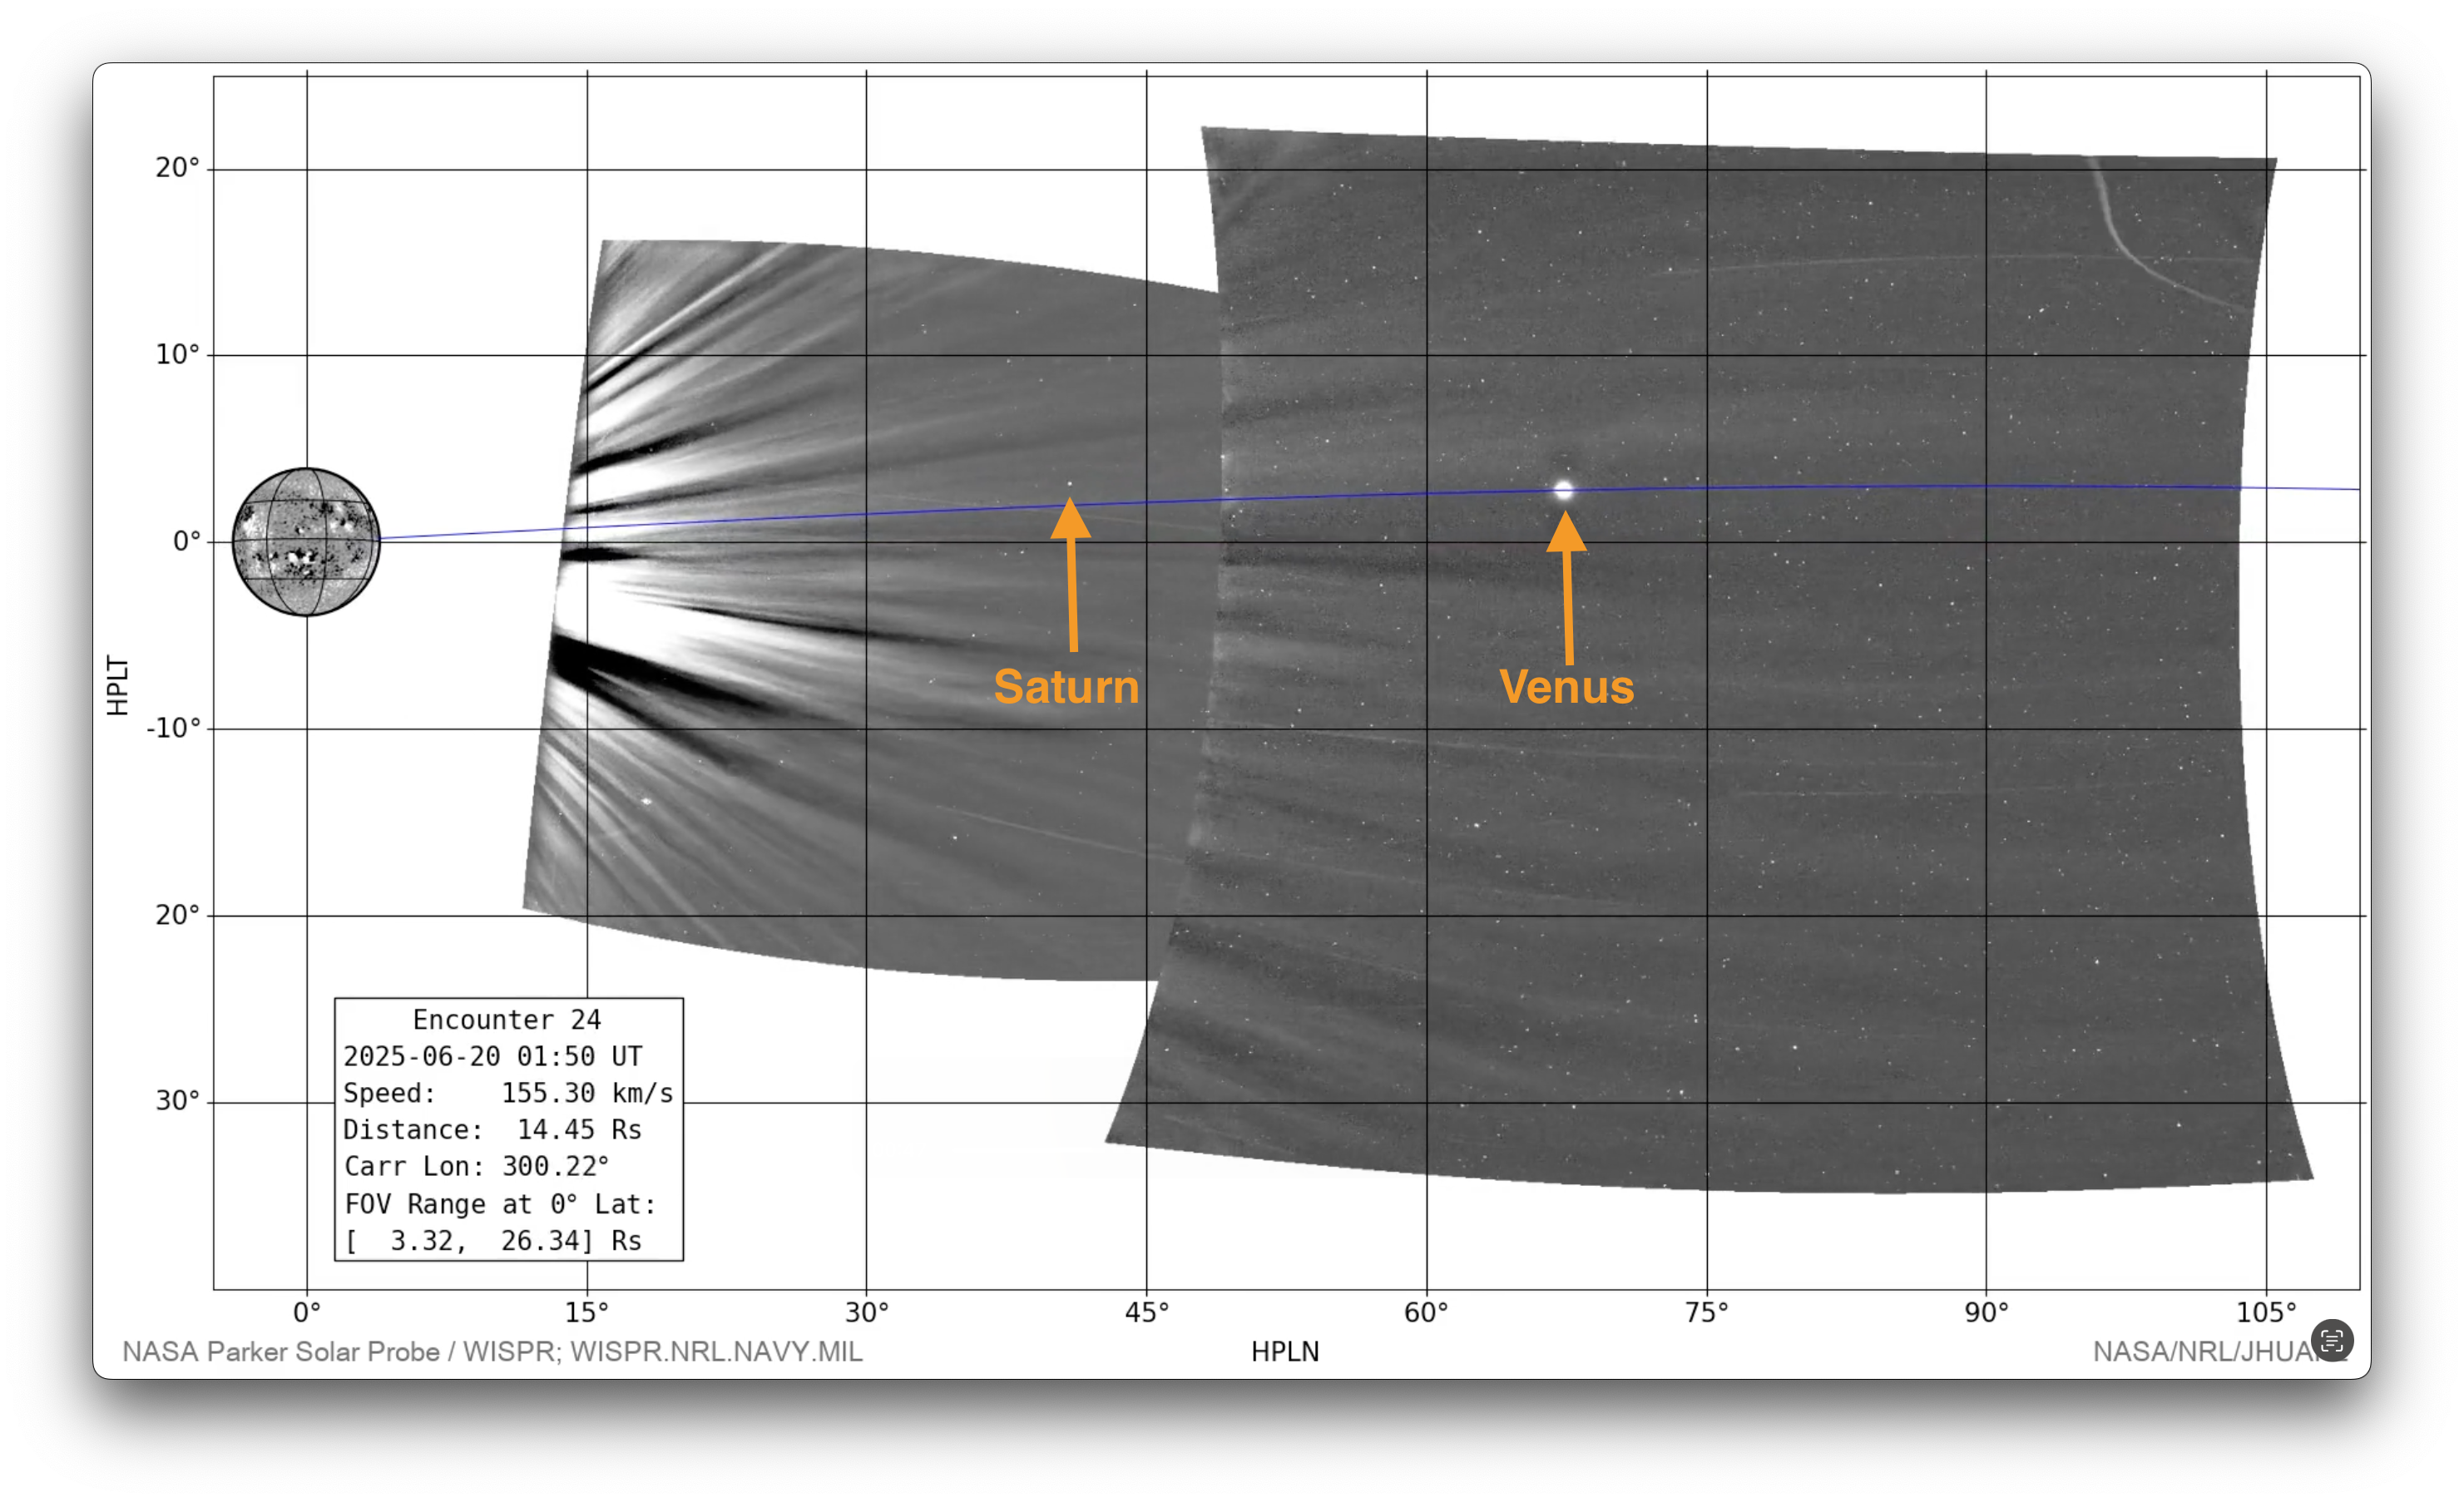
Comets and planets
A few Kreutz sungrazers are visible, along with two small "non-group" comets. Their exact identities still to be determined.
Planets as follows:
Operations summary
On June 20, from the start of the day through 22:00 UT, WISPR-I images were taken in full detector resolution (1920x2048) instead of the normal 2x2 binning employed for most science observations (the 960x1024 images). The different resolutions introduce complications for the processing of higher level data products as a consistent set throughout the orbit, so binned L2 versions of these full-resolution files were created such that there would be a single, synoptic data set. These binned files have been placed inside in the L2/20250620 directory alongside the rest of the data for that dat. The original, full resolution L2 files can be found in L2/20250620/fullres. If you download the L2 zip file linked below, the full-resolution files are included in there. All L2b, L3 and LW fits files, as well as movies and pngs, are based only on the binned L2s -- there are no L2b or L3 files for the full-resolution data.
Furthermore, on 2024-06-19, between 09:00 and 11:00 UT, a new experimental schedule was run to test a low gain mode in the outer telescope, to support shorter exposure times in the inner telescope around perihelion with a unique ‘region’ code in the filename ‘2212’ (compared to the standard products of ‘2222’ and ‘2302’). While successful, this schedule was not used in subsequent orbits, as it was decided that the longer exposure times it required in the outer telescope could potentially introduce motion blur. Instead, a new observing program was created that combined low gain short exposure images in the inner telescope and the standard, high gain images in the outer telescope.
Before the initial E24 data release, these images were inadvertently not processed to level 2 and higher, leaving a two-hour gap in the originally released data for the outer telescope around perihelion. Upon discovery of this oversight, the L2s for this period were created and used to produce L3, L2b and LW products. Because the various methods to generate the backgrounds for these latter products require a series of images in time, images previously released around the two-hour low-gain period were used to help determine the backgrounds of the new images. After confirming that the intensity levels of the original and new images were not significantly impacted by the inclusion of the previously missing files, it was decided that the originally released data would remain in place, and the new images taken during the low-gain period would be the only products released from this procedure.
As a final note, in the new outer telescope images from this two-hour period, a number of horizontal streaks are visible in the L3 and LW images. This is due to a known difference in the detector when between low and high gain modes. Similar features can be seen in the inner telescope L3 and LW products at gain mode changes in prior orbits. In longer periods of low gain observing, the number of images can be used to limit the impact of these features. With just a two-hour period of images taken in this specific mode, there is not enough data to diminish these streaks, leaving them throughout the images.
Miscellaneous notes
None.
Encounter 24 Data Products
- Encounter 24 Level-2 FITS (28 GB zip file)
- Encounter 24 Level-2b FITS, Background Models (20 GB zip file)
- Encounter 24 Level-3 FITS (19 GB zip file)
- Encounter 24 L1 and L2 Summary Files (<1 MB zip file)
- Encounter 24 Level-3 PNGs, Inner camera (2.2 GB zip file)
- Encounter 24 Level-3 PNGs, Outer camera (2.5 GB zip file)
- Encounter 24, Inner mpg, 480x512px (93 MB)
- Encounter 24, Inner mpg, 960x1024px (561 MB)
- Encounter 24, Outer mpg, 480x512px (276 MB)
- Encounter 24, Outer mpg, 960x1024px (1.4Gb)
- Encounter 24, Inner mvi, 480x512px (700 MB)
- Encounter 24, Inner mvi, 960x1024px (2.7 GB)
- Encounter 24, Outer mvi, 480x512px (665 MB)
- Encounter 24, Outer mvi, 960x1024px (2.6 GB)
Encounter 24 J-maps, R-maps, and Lat-maps
The following data products are J-maps, R-maps, and Lat-maps for this Encounter, provided by NASA/JPL/CALTECH. Some reference on the use and interpretation of elongation versus time maps (aka J-maps) are Sheeley et al., 1999 ( DOI: 10.1029/1999JA900308), Sheeley et al., 2008 ( DOI: 10.1086/529020) and Rouillard et al., 2010 ( DOI: 10.1029/2009JA014472). A reference for the creation and use of R-maps is Nindos et al., 2021 (DOI: 10.1051/0004-6361/202039414). Various ways of constructing Latitude versus Time maps are described in Poirier et al., 2020 (DOI: 10.3847/1538-4365/ab6324), Nindos et al., 2021 (DOI: 10.1051/0004-6361/202039414), and Liewer et al., 2023 (DOI: /10.3847/1538-4357/acc8c7).
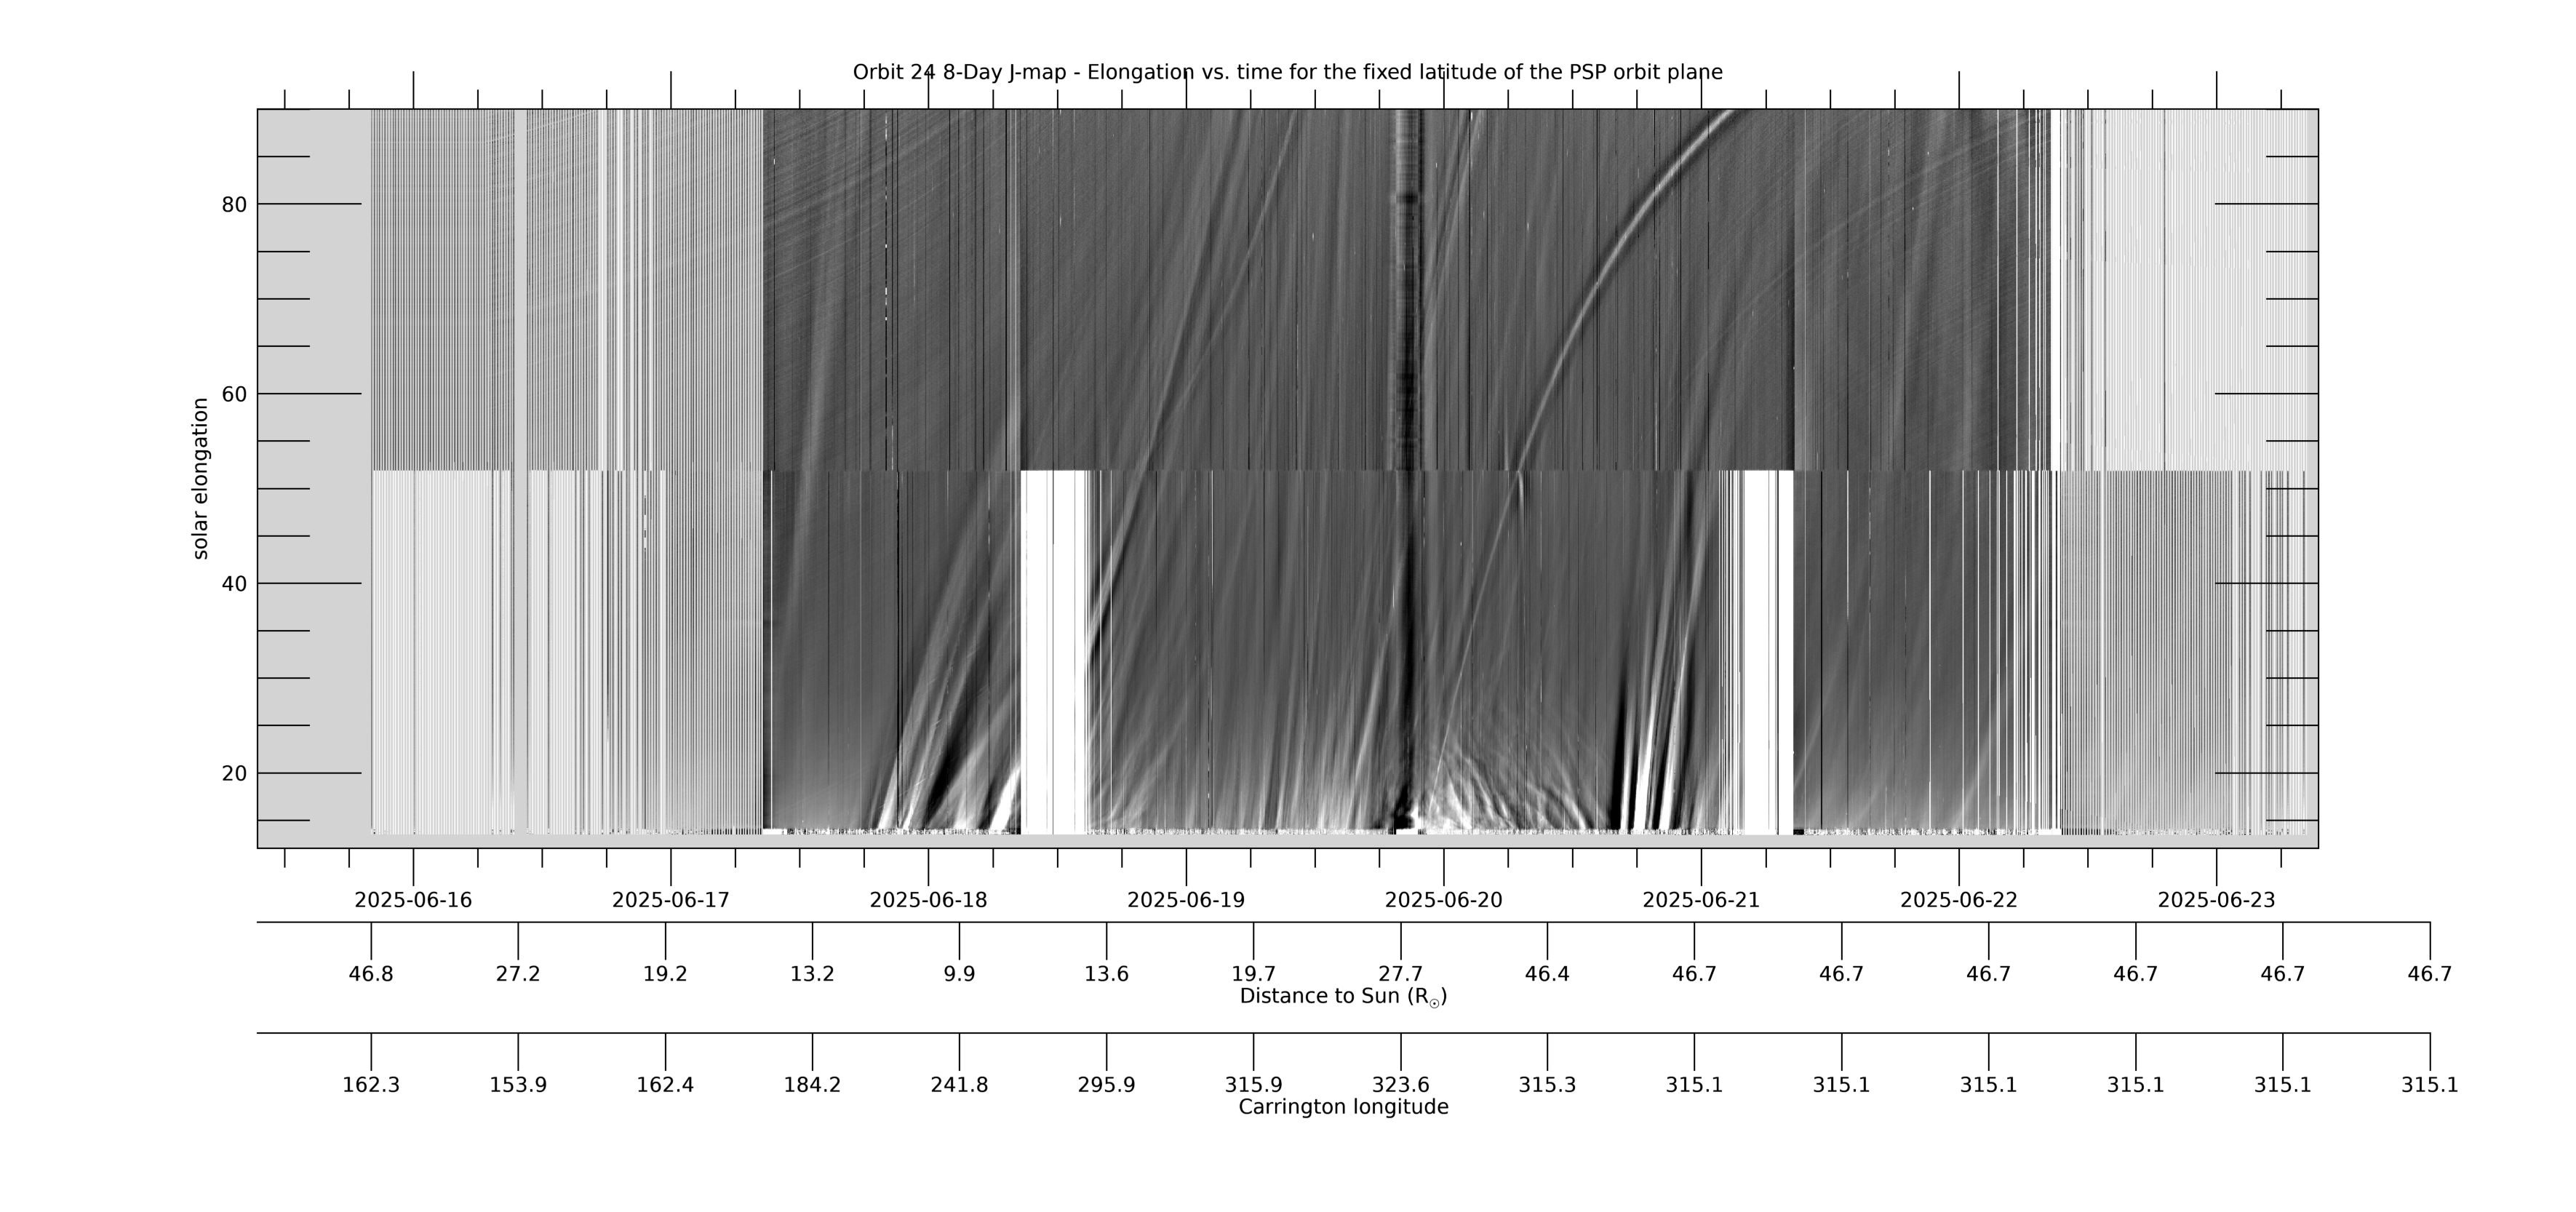
[ABOVE] This 8-day WISPR J-map shows solar elongation (angle from the Sun center) versus time at a fixed latitude measured relative to the PSP-Venus orbit plane. It is created from composite LW-processed full field-of-view (FOV) composite images such as those in the LW movie above, in which the PSP-Venus orbit plane is marked with a blue line. For each image (each time), data is collected along the PSP-Venus orbit plane for the full range of elongations in the WISPR FOV. The collected data is then stacked in time (x-axis) with elongation as the y-axis. The WISPR movies at this web site can be used to identify and find the cause of the various features seen in the J-map. Below the time axis are two additional axes showing PSP’s distance to the Sun RP and its Carrington longitude at that time. The time span in this and subsequent maps is centered on the time of perihelion. [Credit: NASA/JPL. Data processed by Paulo Penteado (JPL/Caltech).]
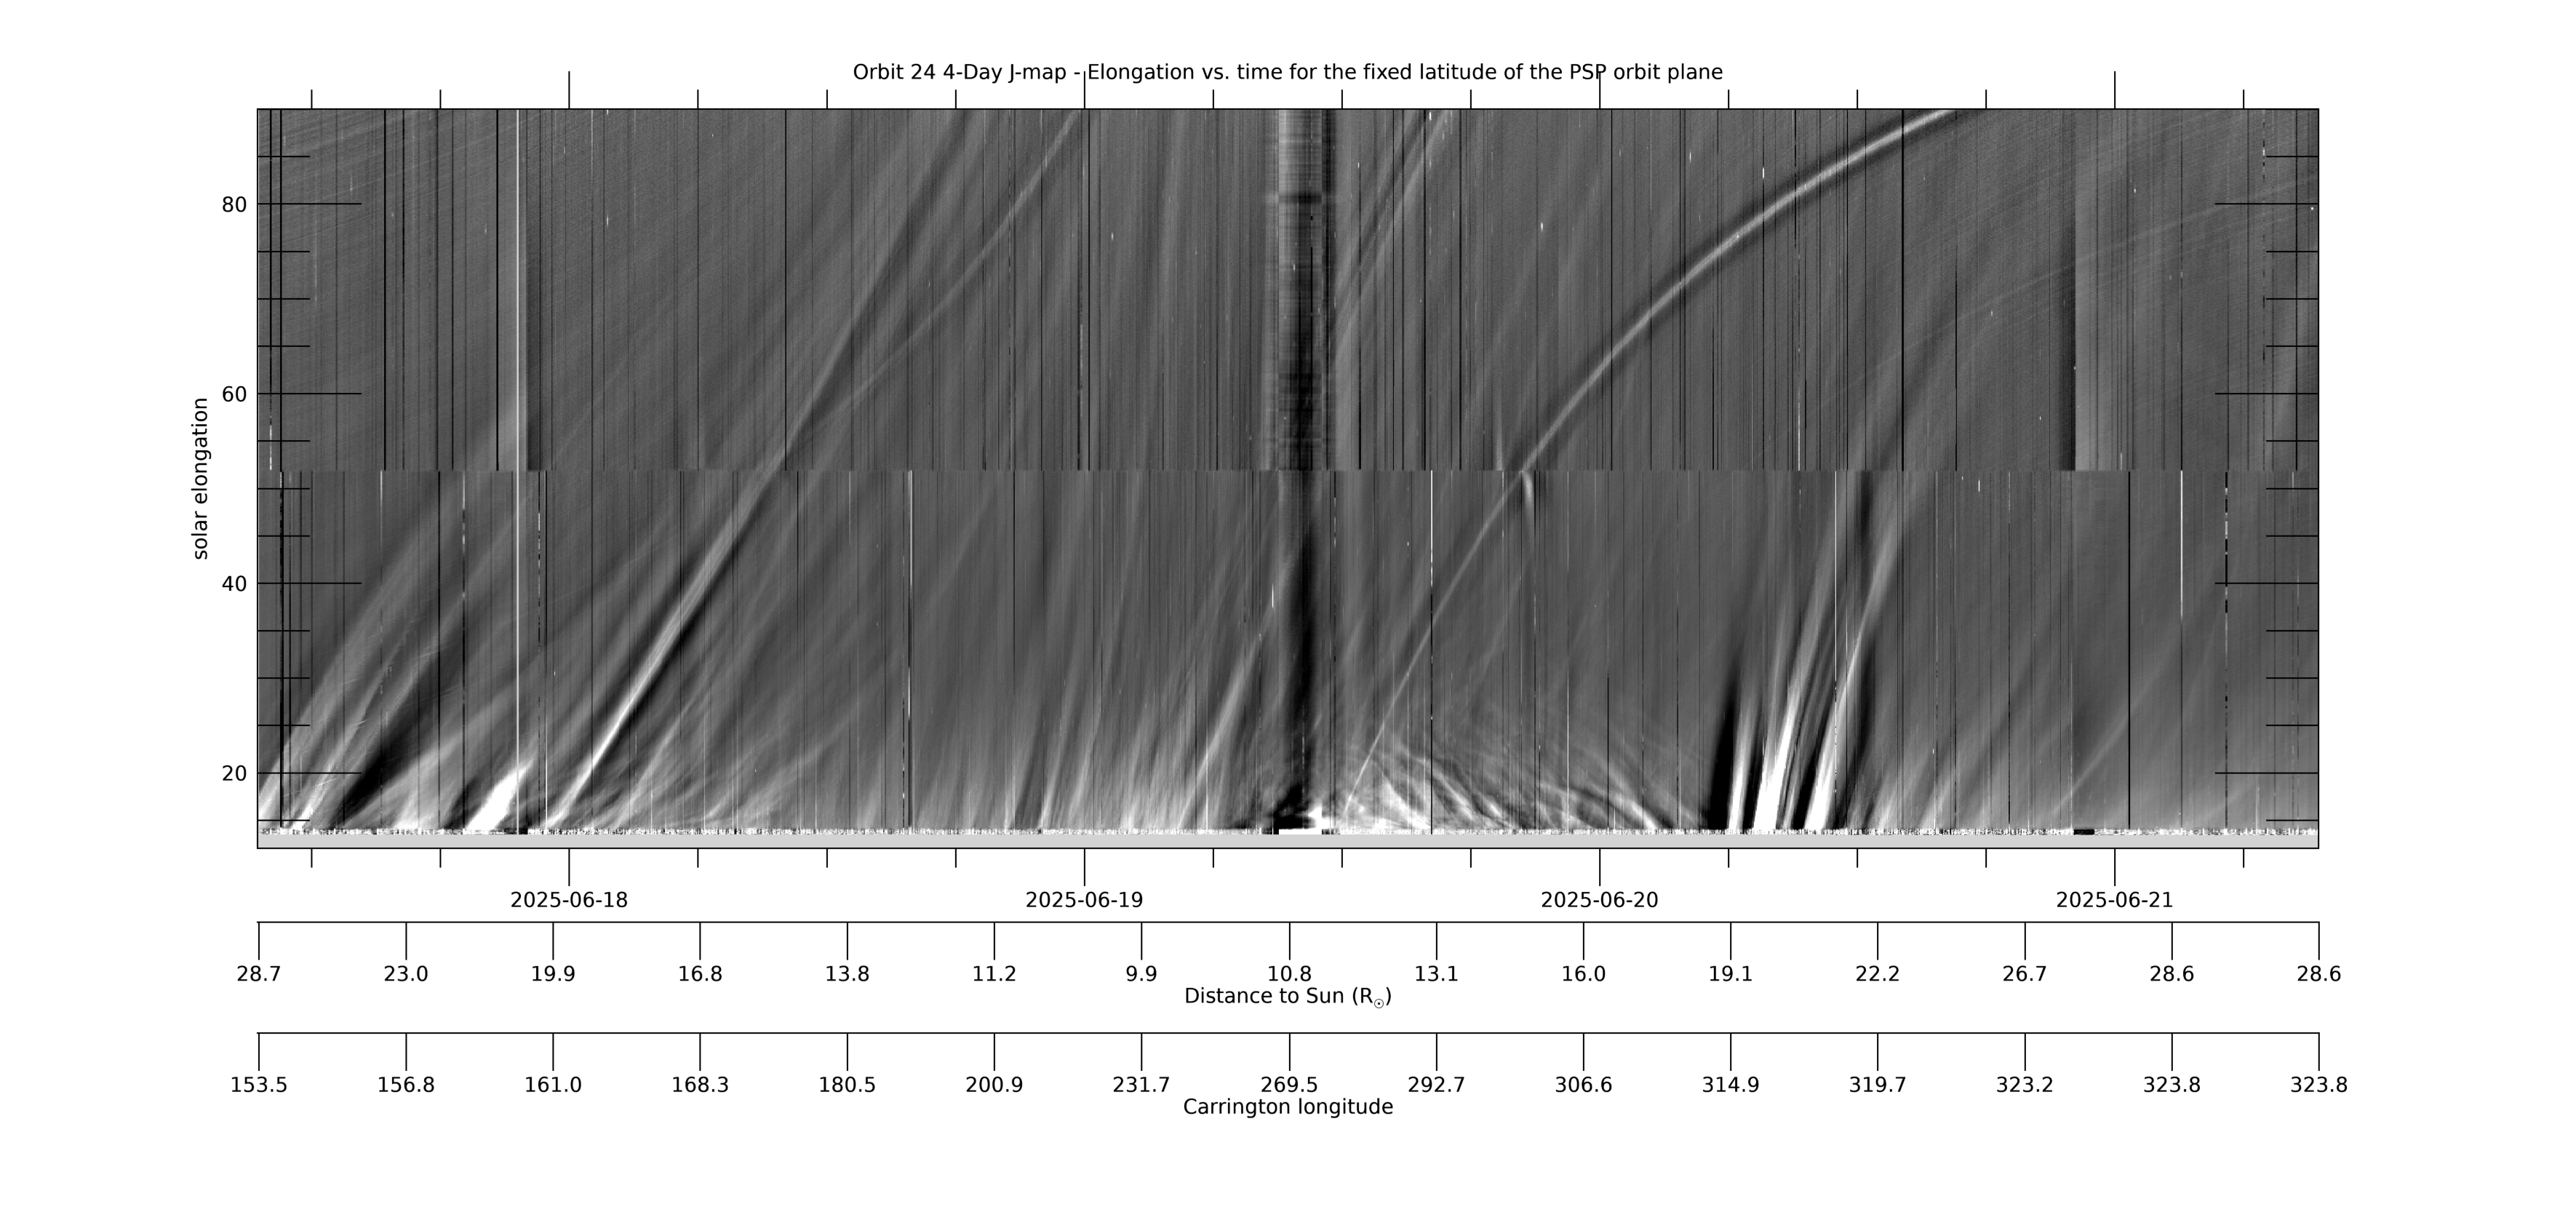
[ABOVE] This 4-day WISPR J-map uses the same data as the 8-day J-map above, but shows only 4 days, centered on perihelion, and only includes distances to 25 R☉ to provide better resolution. See the caption above for more information. [Credit: NASA/JPL. Data processed by Paulo Penteado (JPL/Caltech).]
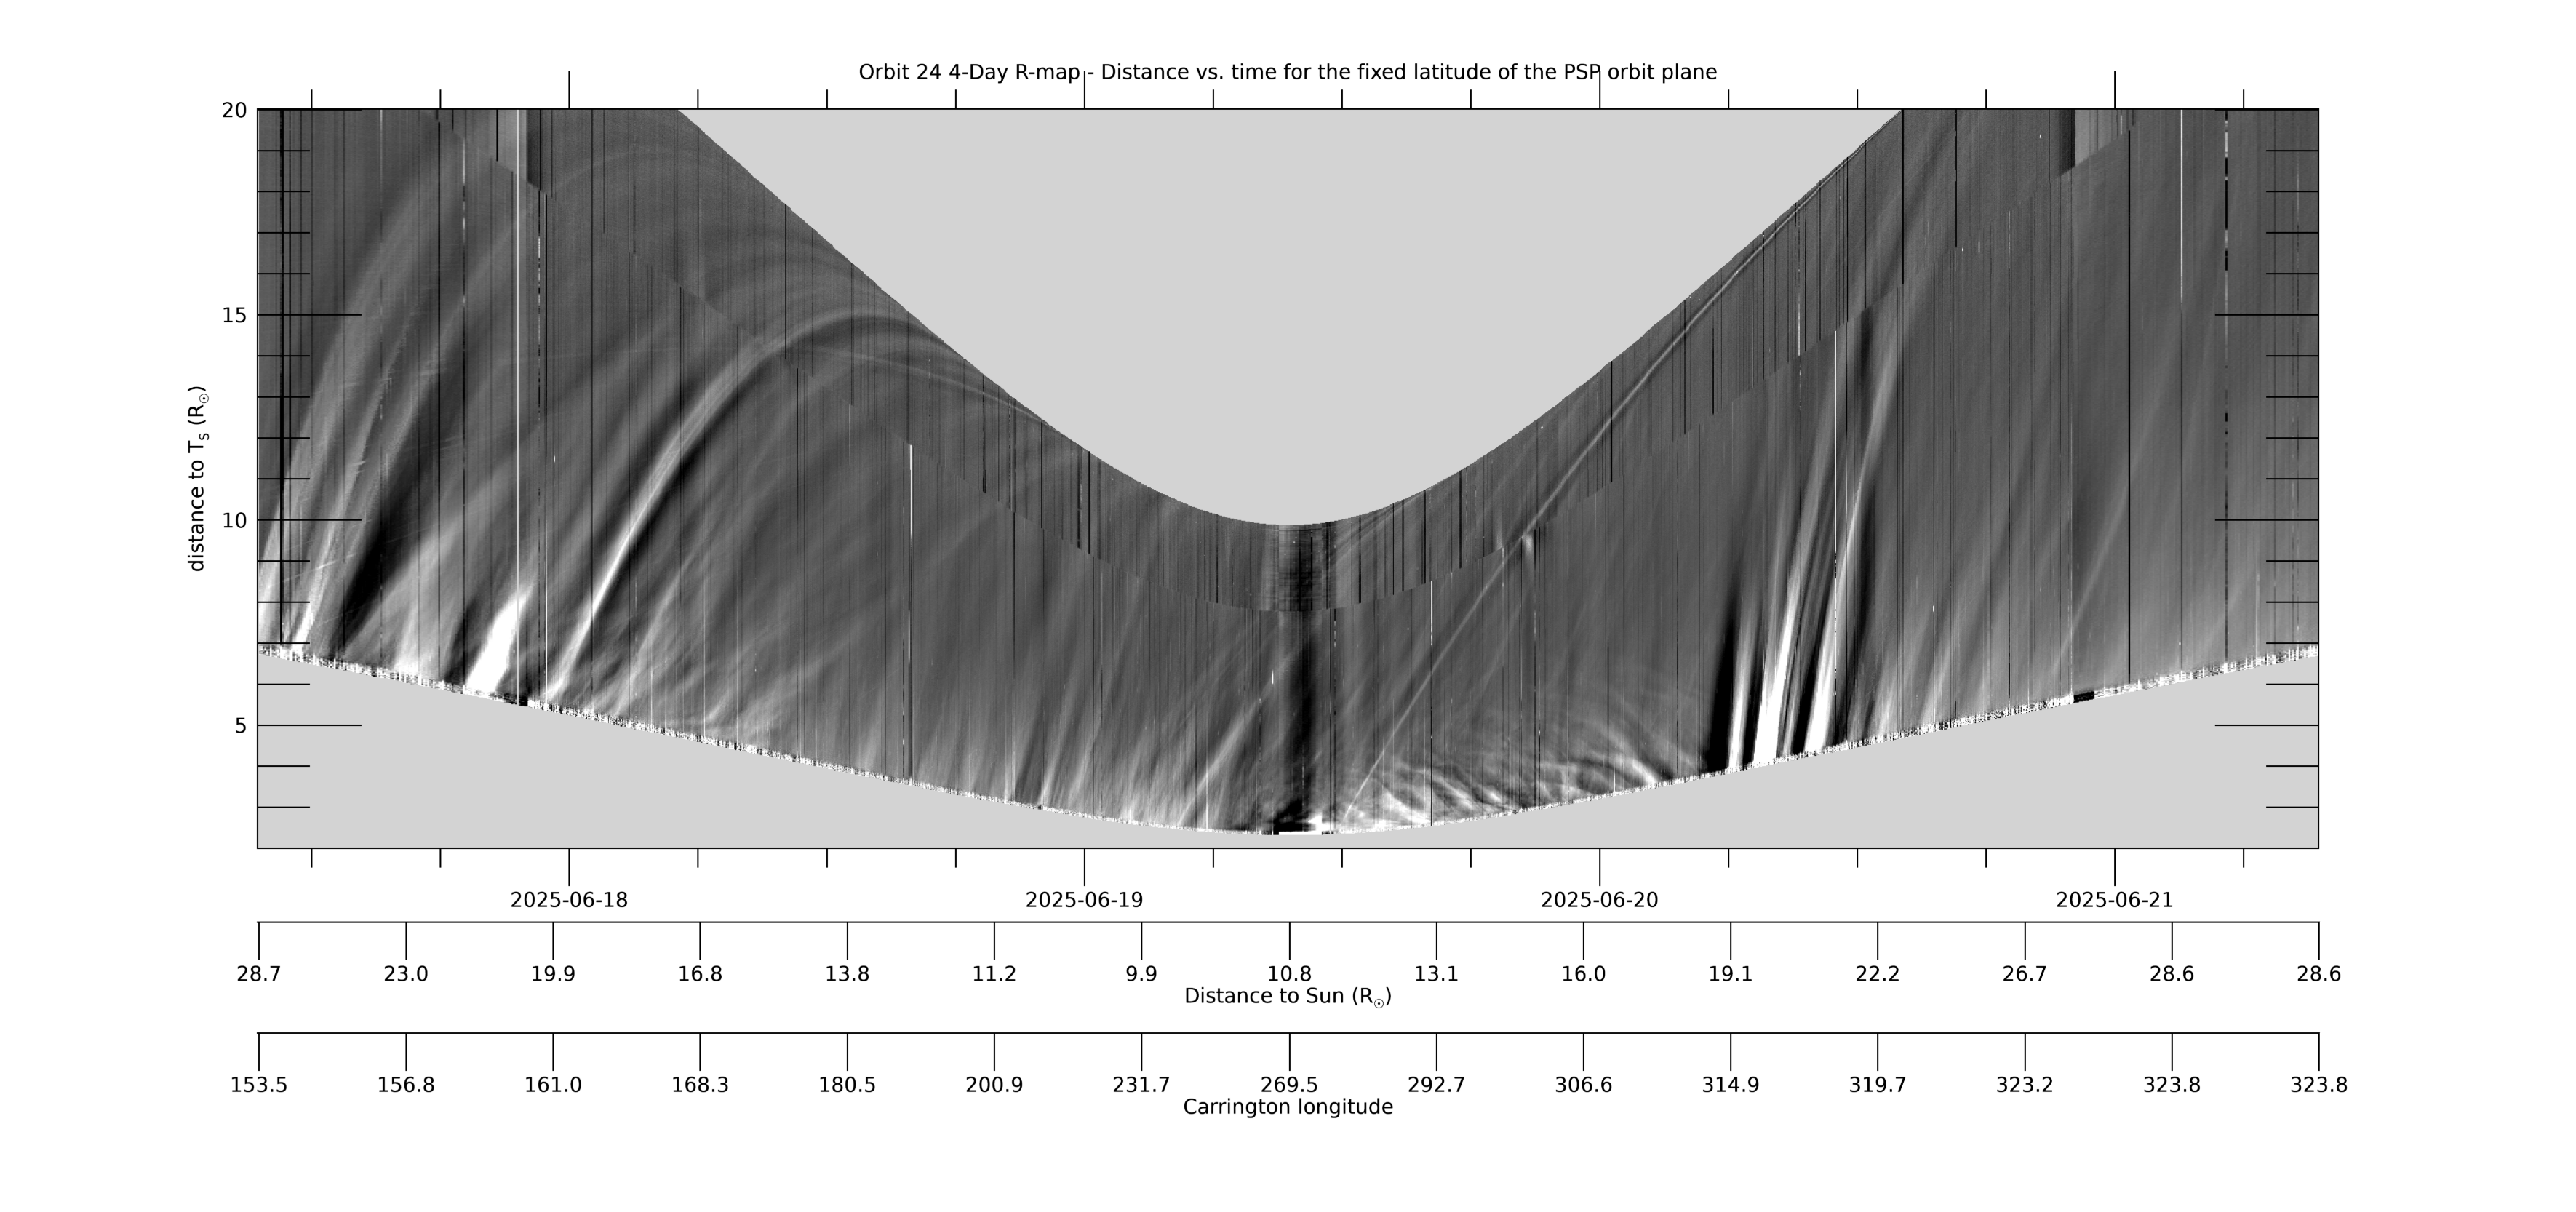
[ABOVE] This 4-day R-map uses the same data as the 4-day J-map (the data collected at each time/image along the PSP-Venus orbit plane), but makes the assumption that the (line-of-sight integrated) signal at each solar elongation all comes from where that line-of-sight hits the Thomson sphere, which is the location of maximum sensitivity of a white light telescope (see, e.g., Vourlidas & Howard, 2006, ApJ,642,1216; DOI: 10.1086/501122). This distance RT (the new y-axis) is related to the elongation by RT=RP*sin(elongation), where RP is PSP’s distance to the Sun. The R-map can be considered a “height-time” plot with and such maps can be used to estimate of the velocity of the observed transients. The LW composite movie above can be used to identify and find the cause of the various features seen in the R-map. Only data up to 90° has been included. [Credit: NASA/JPL. Data processed by Paulo Penteado (JPL/Caltech).]
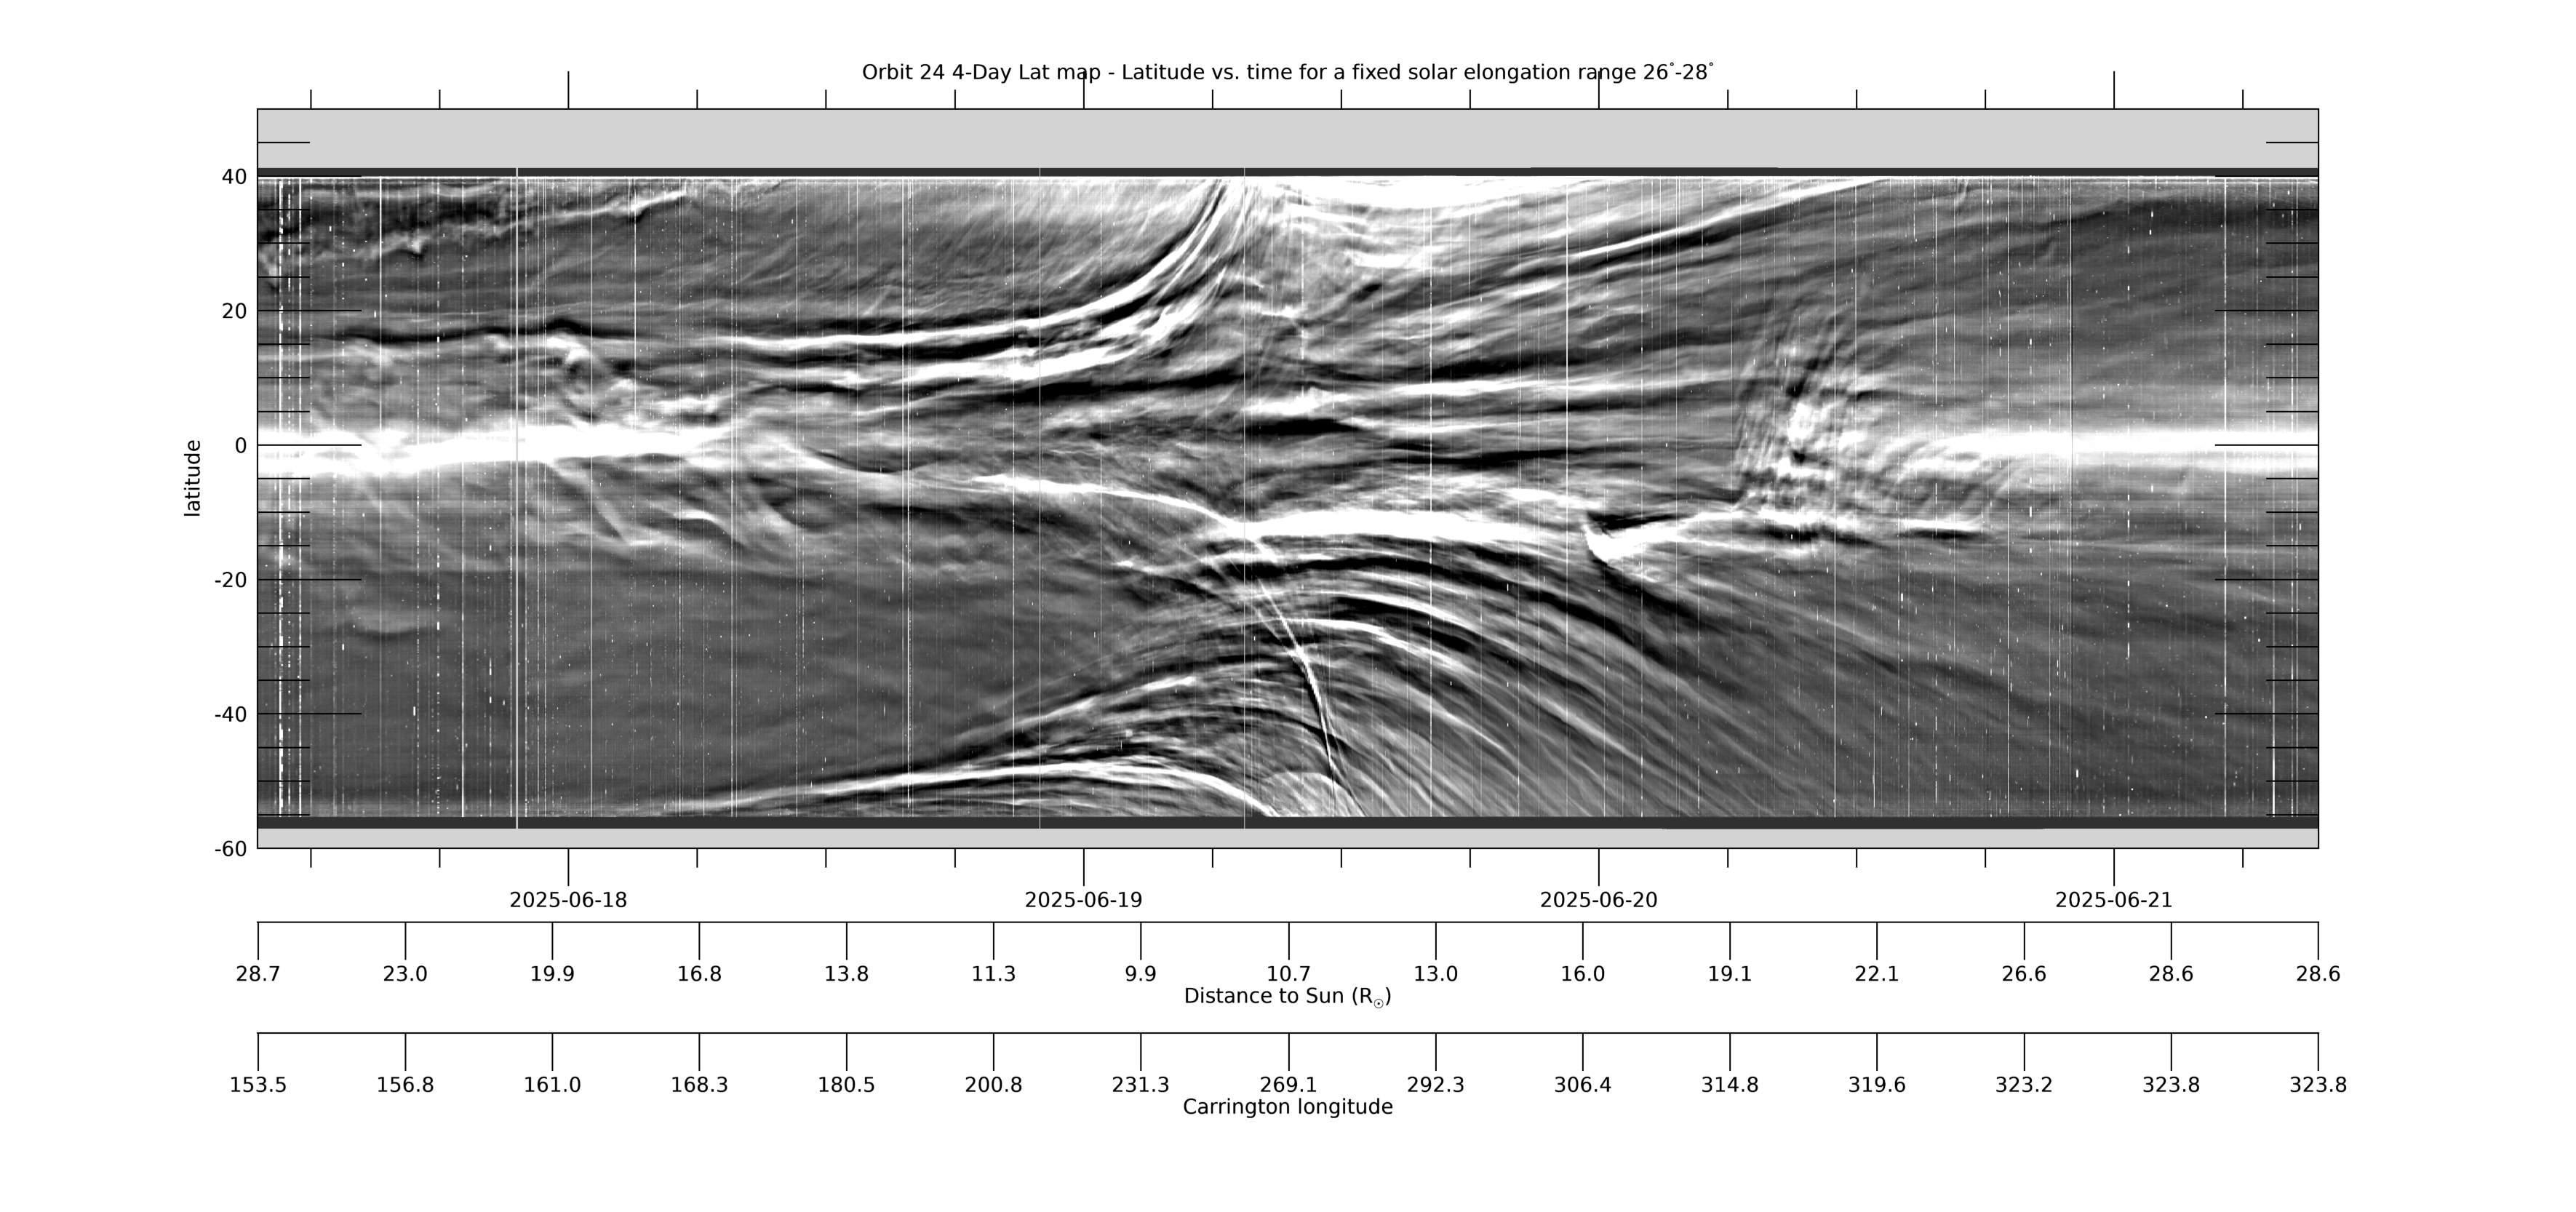
[ABOVE] This 4-day Lat-map shows the evolution in latitude, measured from the PSP-Venus orbit plane, for a fixed solar elongation of 26°-28°. The map is created from L3-processed images by collecting the arc of data in the WISPR-I FOV in the range 26°-28°elongation from each image and stacking the data horizontally in time (for details, see Liewer et al, 2023; DOI: 10.3847/1538-4357/acc8c7). Near perihelion when PSP is moving faster than the Sun rotates, quasi-stationary coronal rays may show large changes in apparent latitude as they approach and pass over or under the spacecraft. The map was created using L3 processed images. The L3 movies at this web site can be used to identify features seen in the Lat-map. [Credit: NASA/JPL. Data processed by Paulo Penteado (JPL/Caltech).]
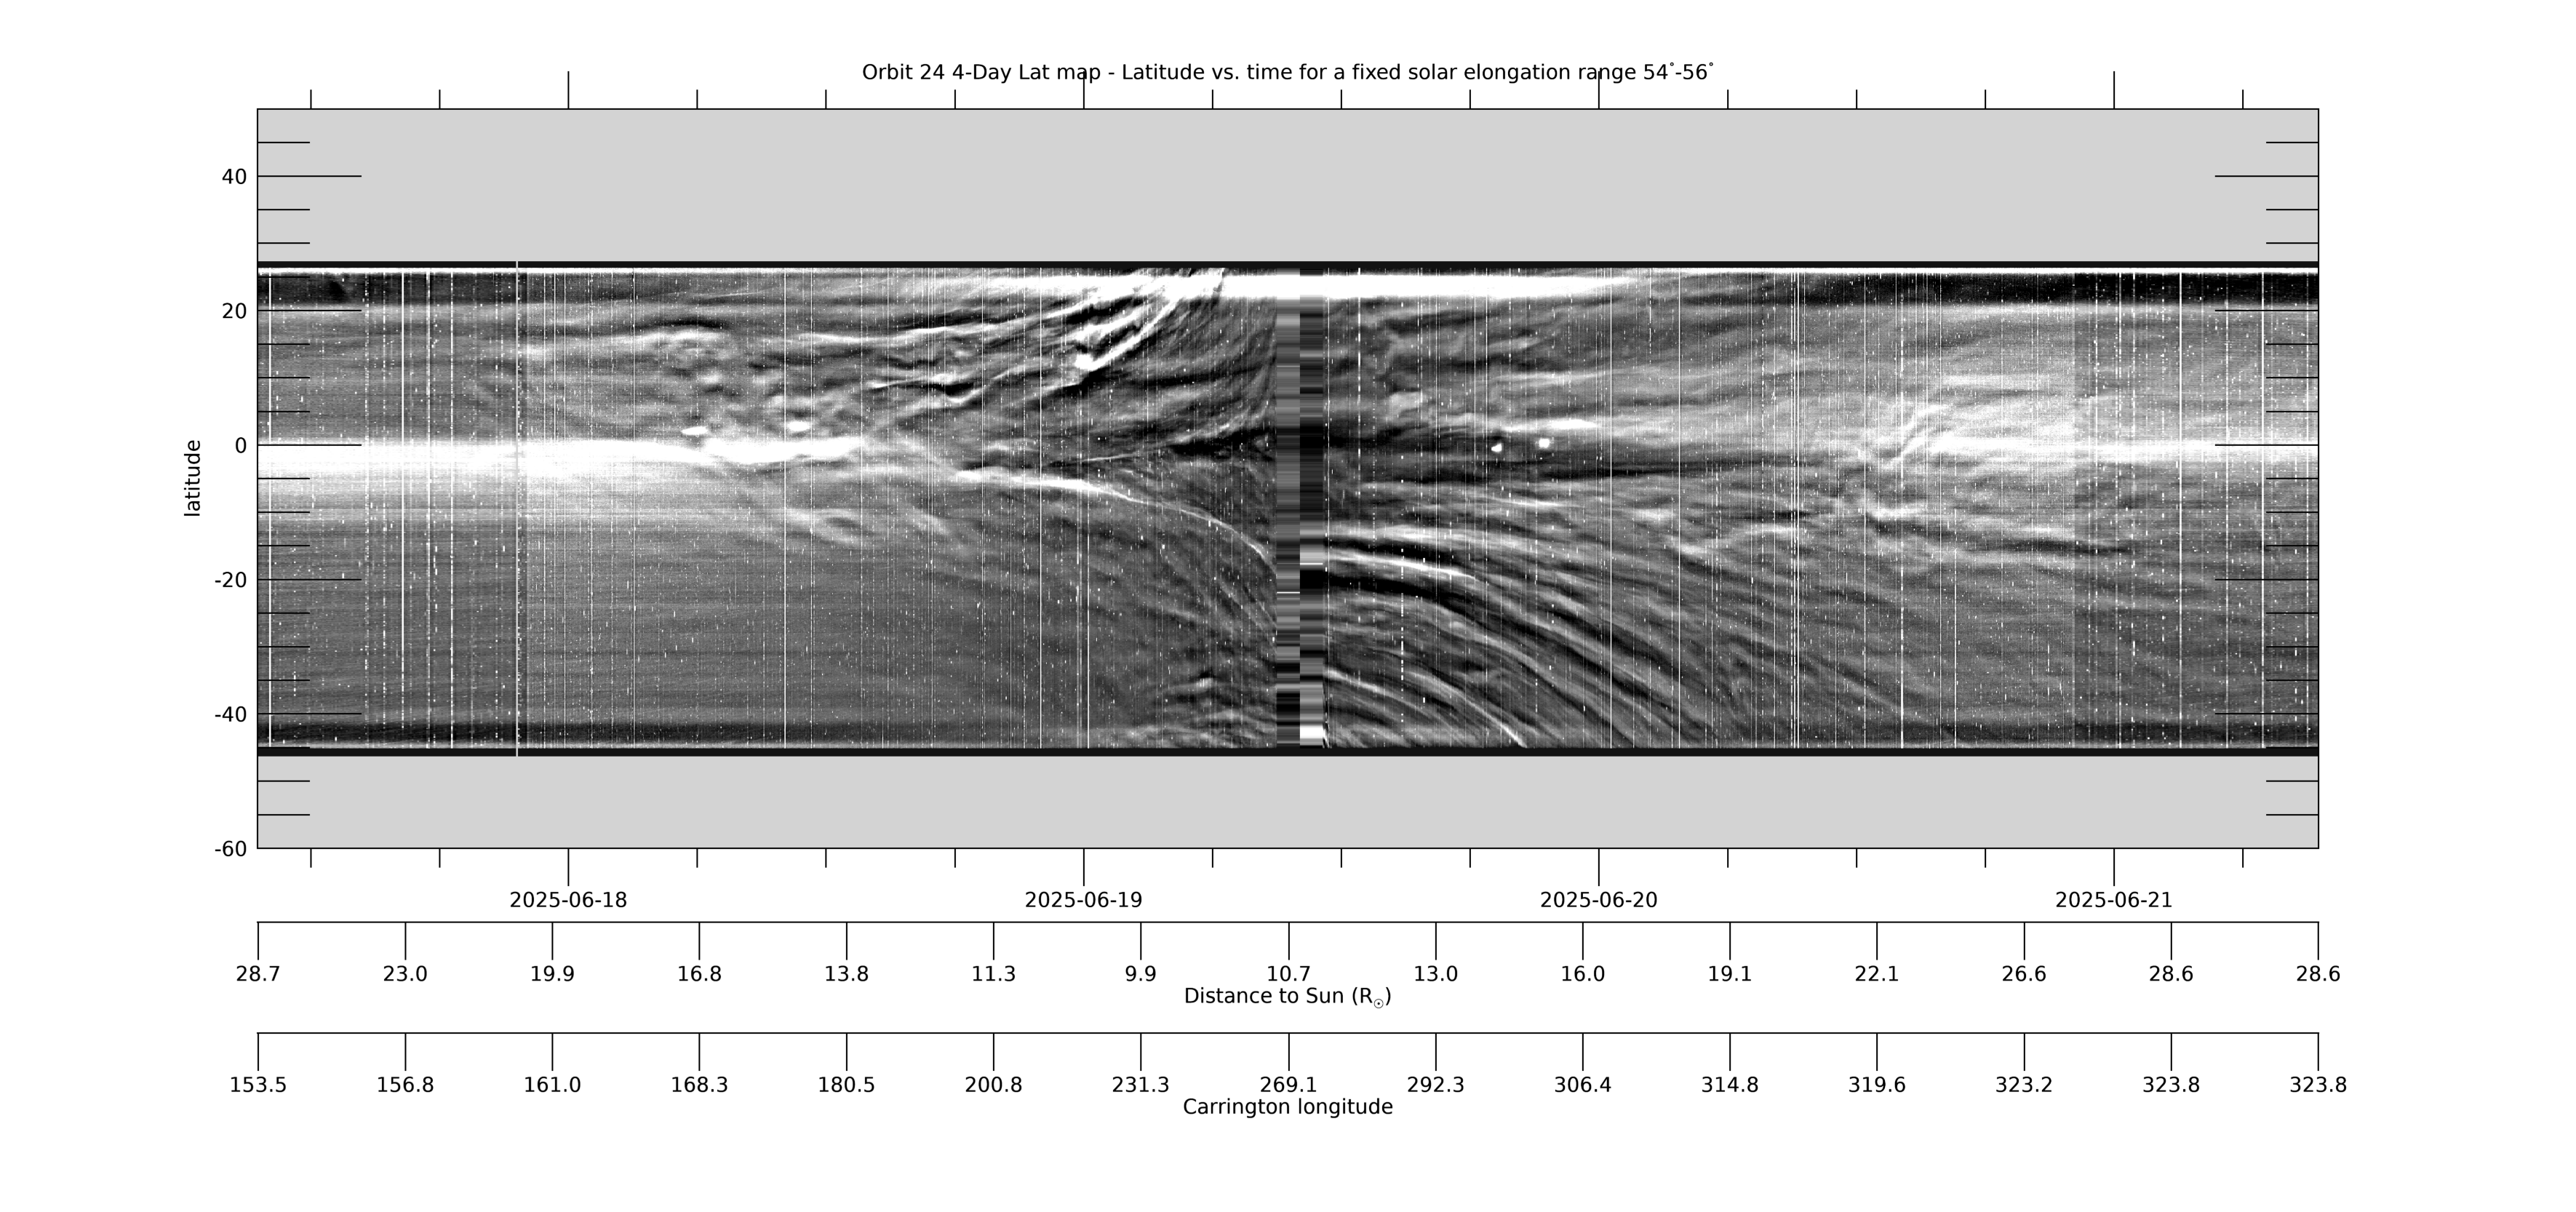
[ABOVE] This 4-day Lat-map shows the evolution in latitude, measured from the PSP-Venus orbit plane, by collecting the arc of data in the WISPR-O FOV for a fixed solar elongation range of 54°-56°. It is made in the same way as the WISPR-I Lat-map above. See that caption for more information. [Credit: NASA/JPL. Data processed by Paulo Penteado (JPL/Caltech).]
Released data for all encounters can be obtained from our WISPR Data Page. Descriptions of other encounters can be found on the Encounter Summaries Page.